
Scroll Vertically -
Scroll Vertically -
Scroll Vertically -

Scroll Vertically -
Scroll Vertically -
Scroll Vertically -


Uga Station
Designing and building an industry-specific operations CRM for complex service workflows
Ownership
UGA Station is a fully built, demoable AEC (Architectural Engineering & Construction) internal operations platform created to explore how complex service organisations achieve real-time operational clarity across sales, delivery, finance, and leadership.
Retrospect:
Building a live system exposed edge cases and data dependencies that static design artefacts would have hidden.
Role
Product Designer & Builder
(Product strategy, UX systems, AI integration, frontend)
Stack
Enterprise SaaS
RBAC
Real-time data
Google Studio
Firebase
Flutterflow
Design
Built
Primary Users
Founders
Sales leads
Operations managers
Architects/Designers
Deliverable Teams
Product Scope
Dashboard
Sales
Projects
Tasks
Payments
Organisation
Healthy Ai
The Critical Problem
Sales data lived separately from delivery
Project status wasn’t tied to revenue
Access control was inconsistent
Founders lacked a real-time view
Each tool is functional on its own. However, they are not connected.
Architecture and design studios lose revenue and time due to fragmented tools that separate sales, projects, tasks, and payments.
Solution
Faster lead follow-up → higher conversion potential
Reduced operational blind spots across projects
Improved payment visibility and cash-flow predictability
Reduced planning overhead via AI-assisted workflows
Healthy Ai
Healthy AI is a dedicated intelligence layer within UGA Station designed to surface early operational risks and patterns across sales, delivery, and finance — while keeping humans fully in control of decisions.
P.s- Decision support, not decision-making
Purpose
Early Risk Signals
Detect issues before they escalate
Inputs
Live System Events
Tasks, milestones, payments, role actions
Output
Explainable Insights
Why this matters, not just what changed
Control
Human in the Loop
AI suggests, people decide
Guardrails
No Auto-Execution
Nothing happens without approval
Success Metric
Actioned Signals
Insights that lead to decisions
Health Score Breakdown
Healthy AI observes system activity, detects patterns, and guides human attention to risk.
Health Dimension
What It Tracks
Direction
Driven By
Timeline Health
Delivery reliability
↑
Overdue tasks & milestones
Financial Health
Revenue realisation strength
↓
Paid vs billed, overdue invoices
Quality Health
Execution consistency
↓
QC checks & issue frequency
Access Exception Rate
Permission-related friction
↓
Failed RBAC checks
Ops Velocity
Operational discipline
↓
Site logs & activity cadence
Total Project Health Score
Overall project risk
↑
Timeline, Finance, Quality, Activity
Metrics define measurement readiness, not post-launch outcomes.
Design Principle
Product Lifecycle
Visibility Before Ownership
Role Based CLarity AT Every Step
product lifecycle
The product is structured around cause-and-effect, not isolated modules
sales
→
Delivery
→
Tasks
→
Payments
→
Roles
→
Health
visibility before optimisation
The product is structured around cause-and-effect, not isolated modules
What was sold
→
What is being delivered
→
What is blocked
→
What is at risk financially
role-based clarity at every step
The product is structured around cause-and-effect, not isolated modules
Fewer accidental actions
Clear ownership
Traceability across decisions
Metric
Metrics as decision signals, not reports
High-level KPIs focus on time to action, delivery predictability, pipeline efficiency, revenue risk, execution blockers, and overall system health to guide leadership decisions at a glance.
Retrospect:
Building a live system exposed edge cases and data dependencies that static design artefacts would have hidden.
High Level KPI Metrics
Dashboard Quality
Fresh Signals
Recent data → better decision confidence
Healthy Ai
AI Risk Signals
Earlier detection → human intervention before failure AKA AI surfaces patterns, humans decide actions
Sales / Conversion
Lead Follow-up Time
Faster follow-up → higher conversion probability
Delivery Health
Blocked Tasks
Early visibility → fewer delivery delays
Payment Risk
Milestone Slippage
Delayed milestones → payment risk signals
Org / RBAC
Permission Violations
Clear roles → fewer operational errors
Measurable Metrics (By Design)
This system is instrumented to be measured from day one.
Metrics use human-readable logic so teams understand why a signal changes — not just that it changed.
Metric
What it Represents
Direction
Measured From
Why it Matters
Signal Freshness
How current the system’s data is
↑
Last update timestamps
Ensures decisions are made on reliable, up-to-date information
Lead Follow-up Time
Speed of response to new leads
↓
Lead creation → first action
Faster follow-up improves conversion efficiency
Blocked Task Ratio
Execution stalled due to dependencies
↓
Blocked tasks / active tasks
Early visibility prevents delivery delays
Access Exception Rate
Permission-related friction
↓
Failed RBAC checks
Reduces operational errors and confusion
Total Project Health Score
Overall project risk
↑
Timeline, Finance, Quality, Activity
Guides leadership attention to high-risk areas
Metrics as decision signals, not reports
Success is communicated through outcome-driven metric cards, each designed to answer a single question:
“What should I act on right now?”
Design Approach
Log In
User enters the product securely.
→
System verifies identity and authentication method.
→
User role and permissions are resolved.
→
User is routed to the correct starting page.

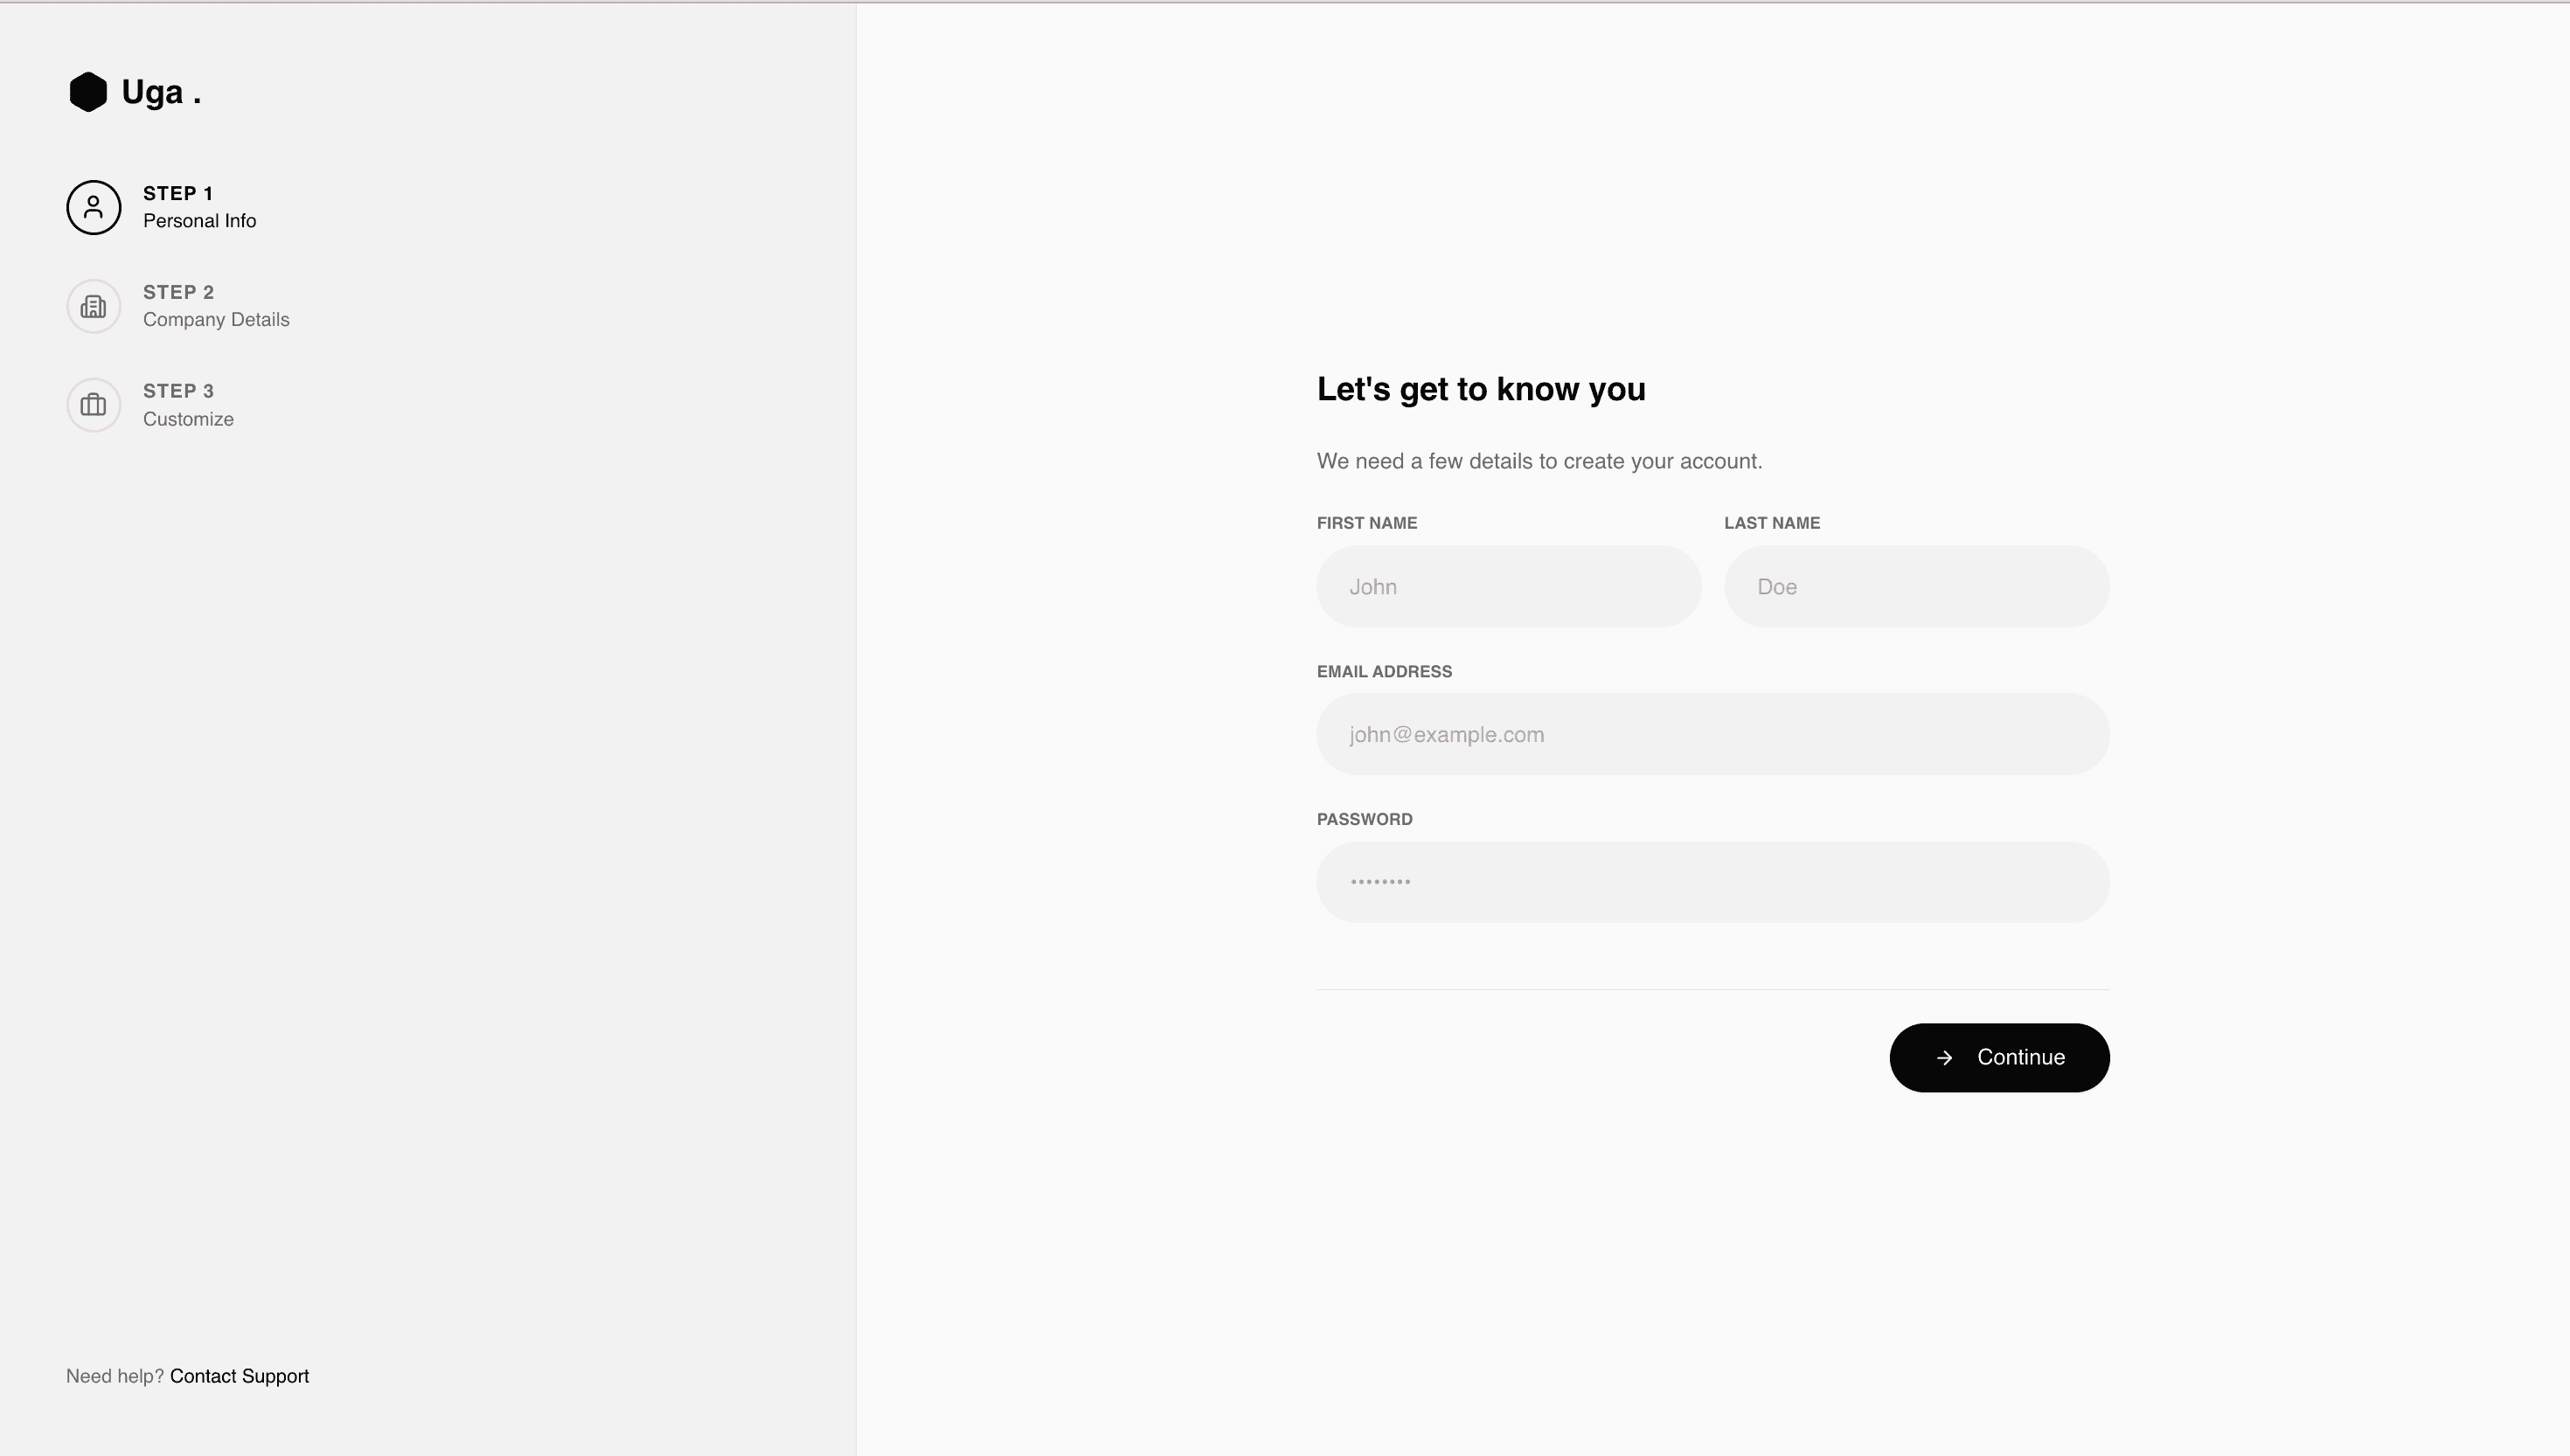
Q1. Why does the user start here?
To securely identify the user before any data or actions are exposed.
Q2. What decision does the system make here?
It determines who the user is and what they are allowed to access.
Q3. What is the outcome of this page?
The user is routed to the correct starting point with the right permissions.
Dashboard
Live activity across projects, quality, sales, and payments
→
Metrics summarised as signals (not reports)
→
Each signal exposes ownership + current state
→
Click takes you to the exact place where action is required
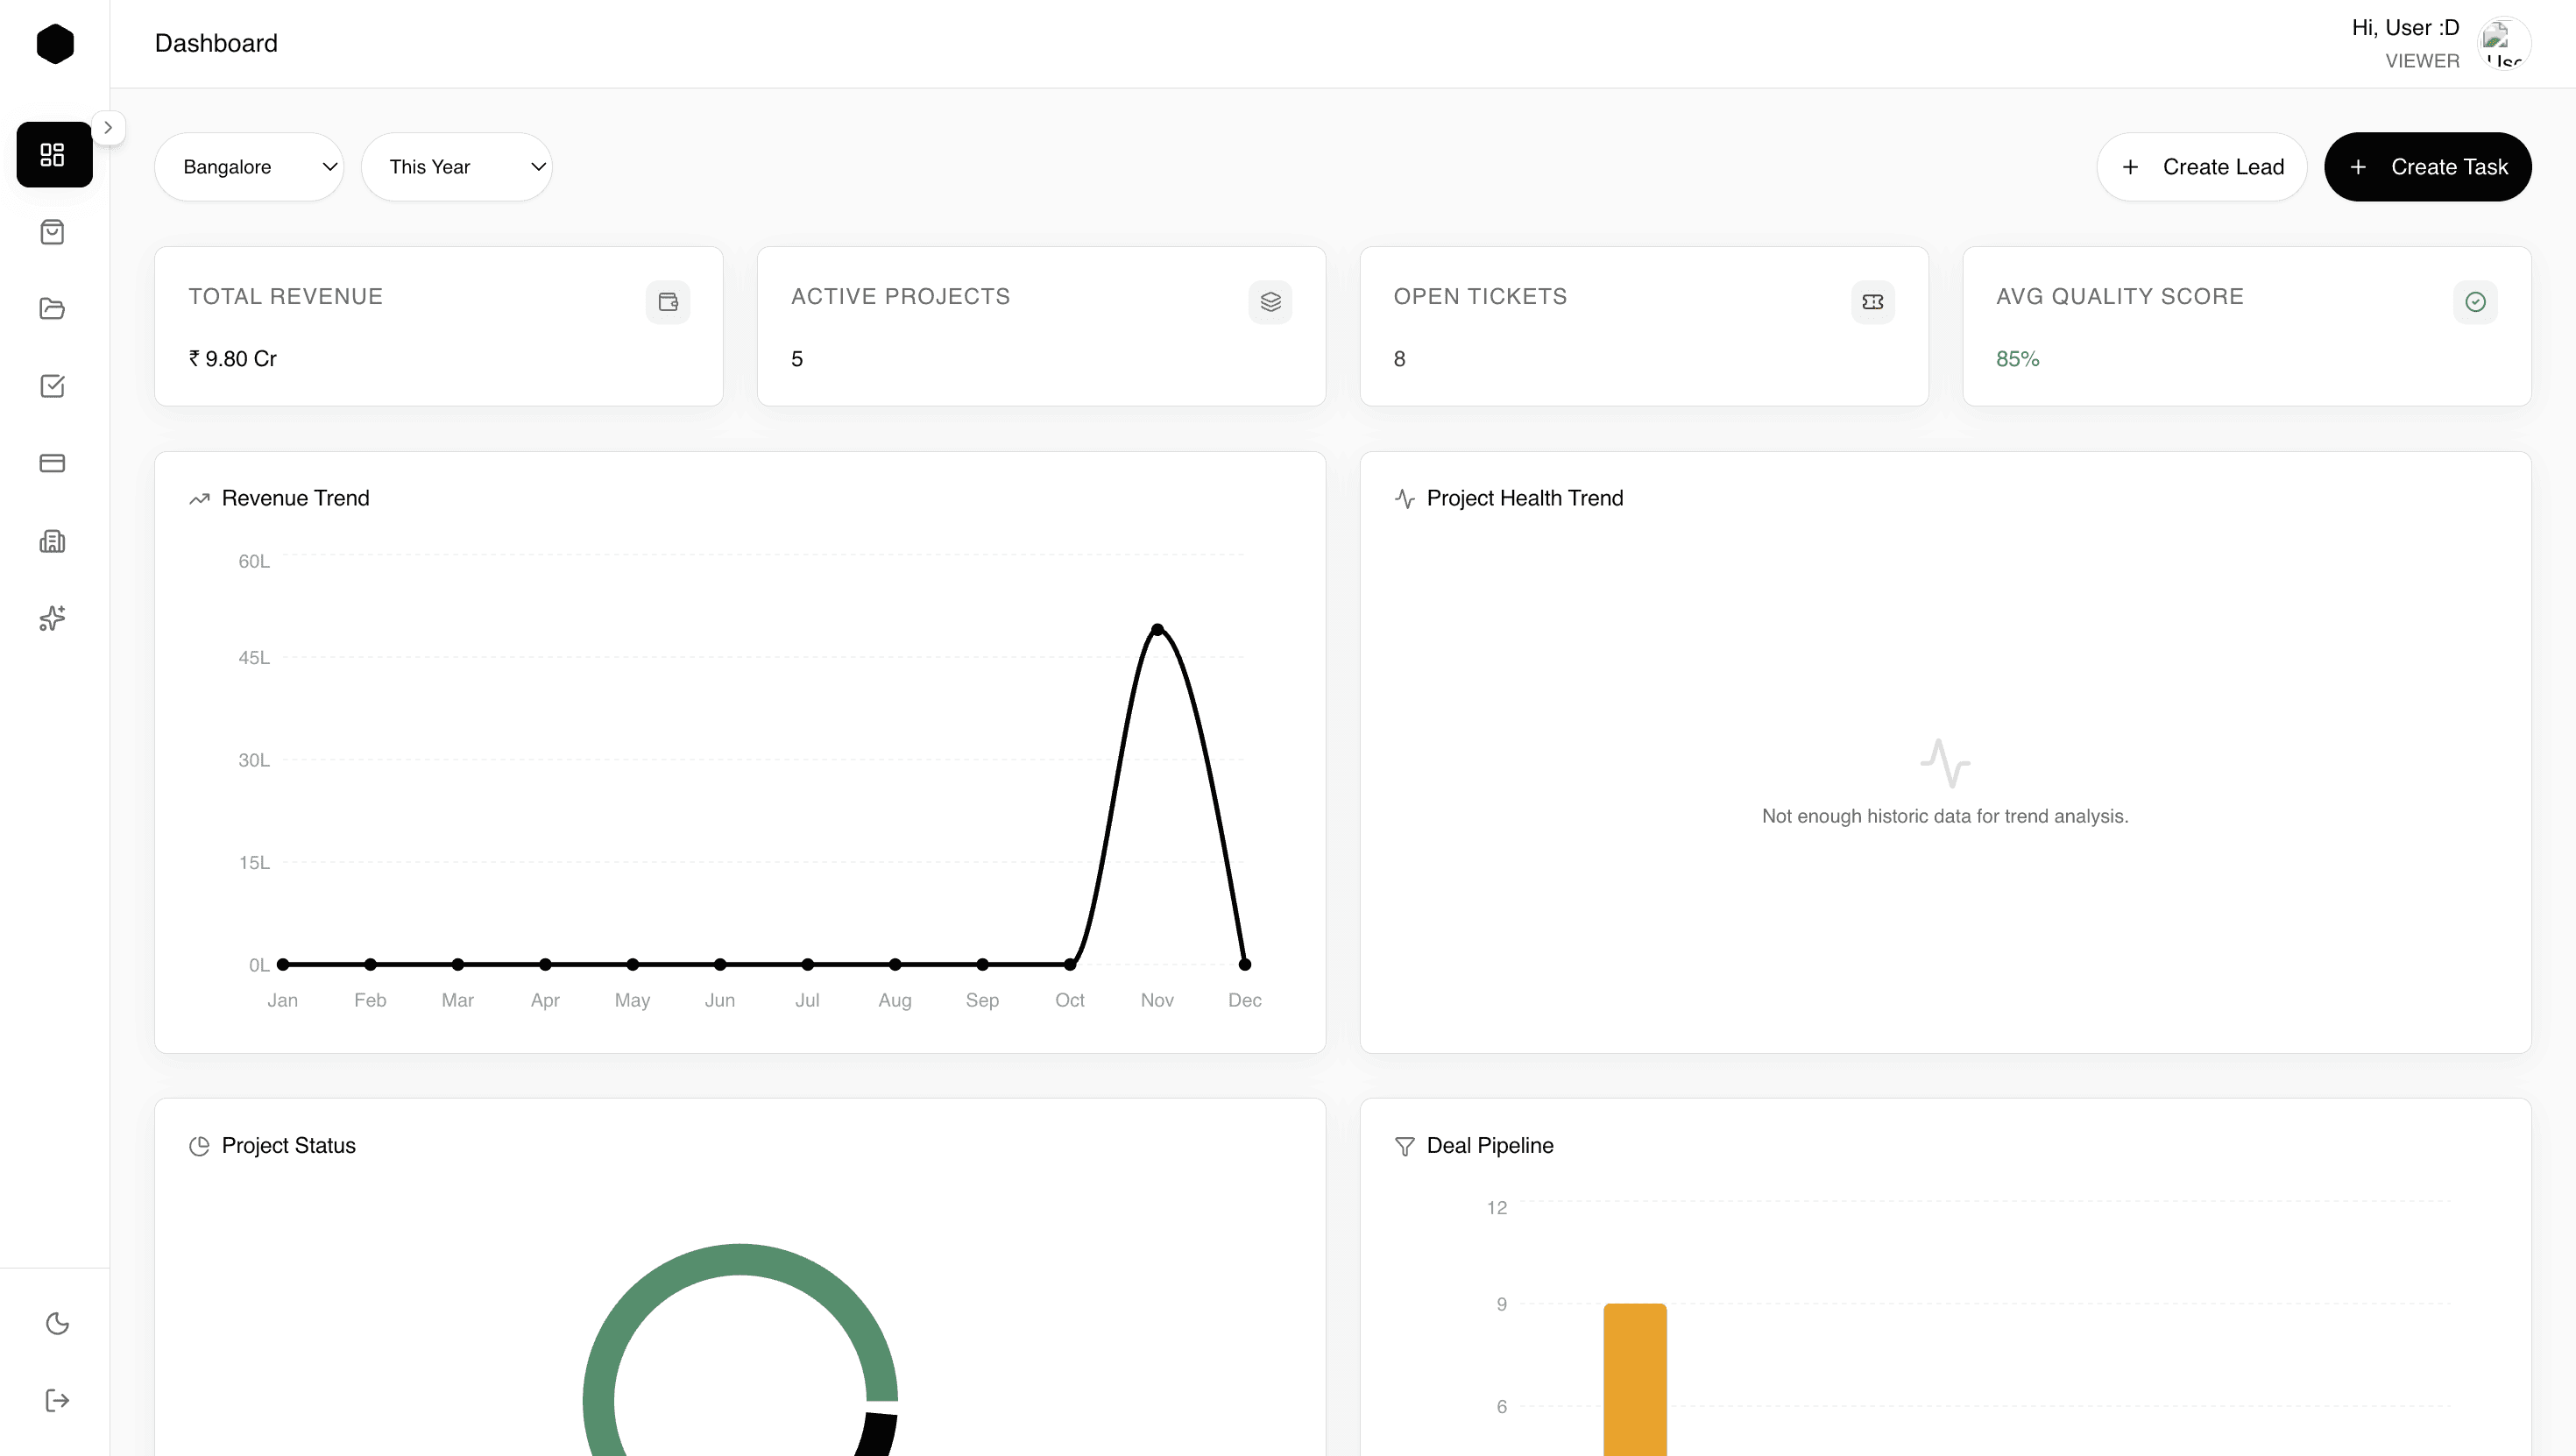
Q1. What question does the dashboard answer?
What needs attention right now.
Q2. Why are signals shown instead of raw data?
To help users understand status instantly without analysis.
Q3. What should the user do next from here?
Jump directly to the area that needs action.
Q1. What question does the dashboard answer?
What needs attention right now.
Q2. Why are signals shown instead of raw data?
To help users understand status instantly without analysis.
Q3. What should the user do next from here?
Jump directly to the area that needs action.
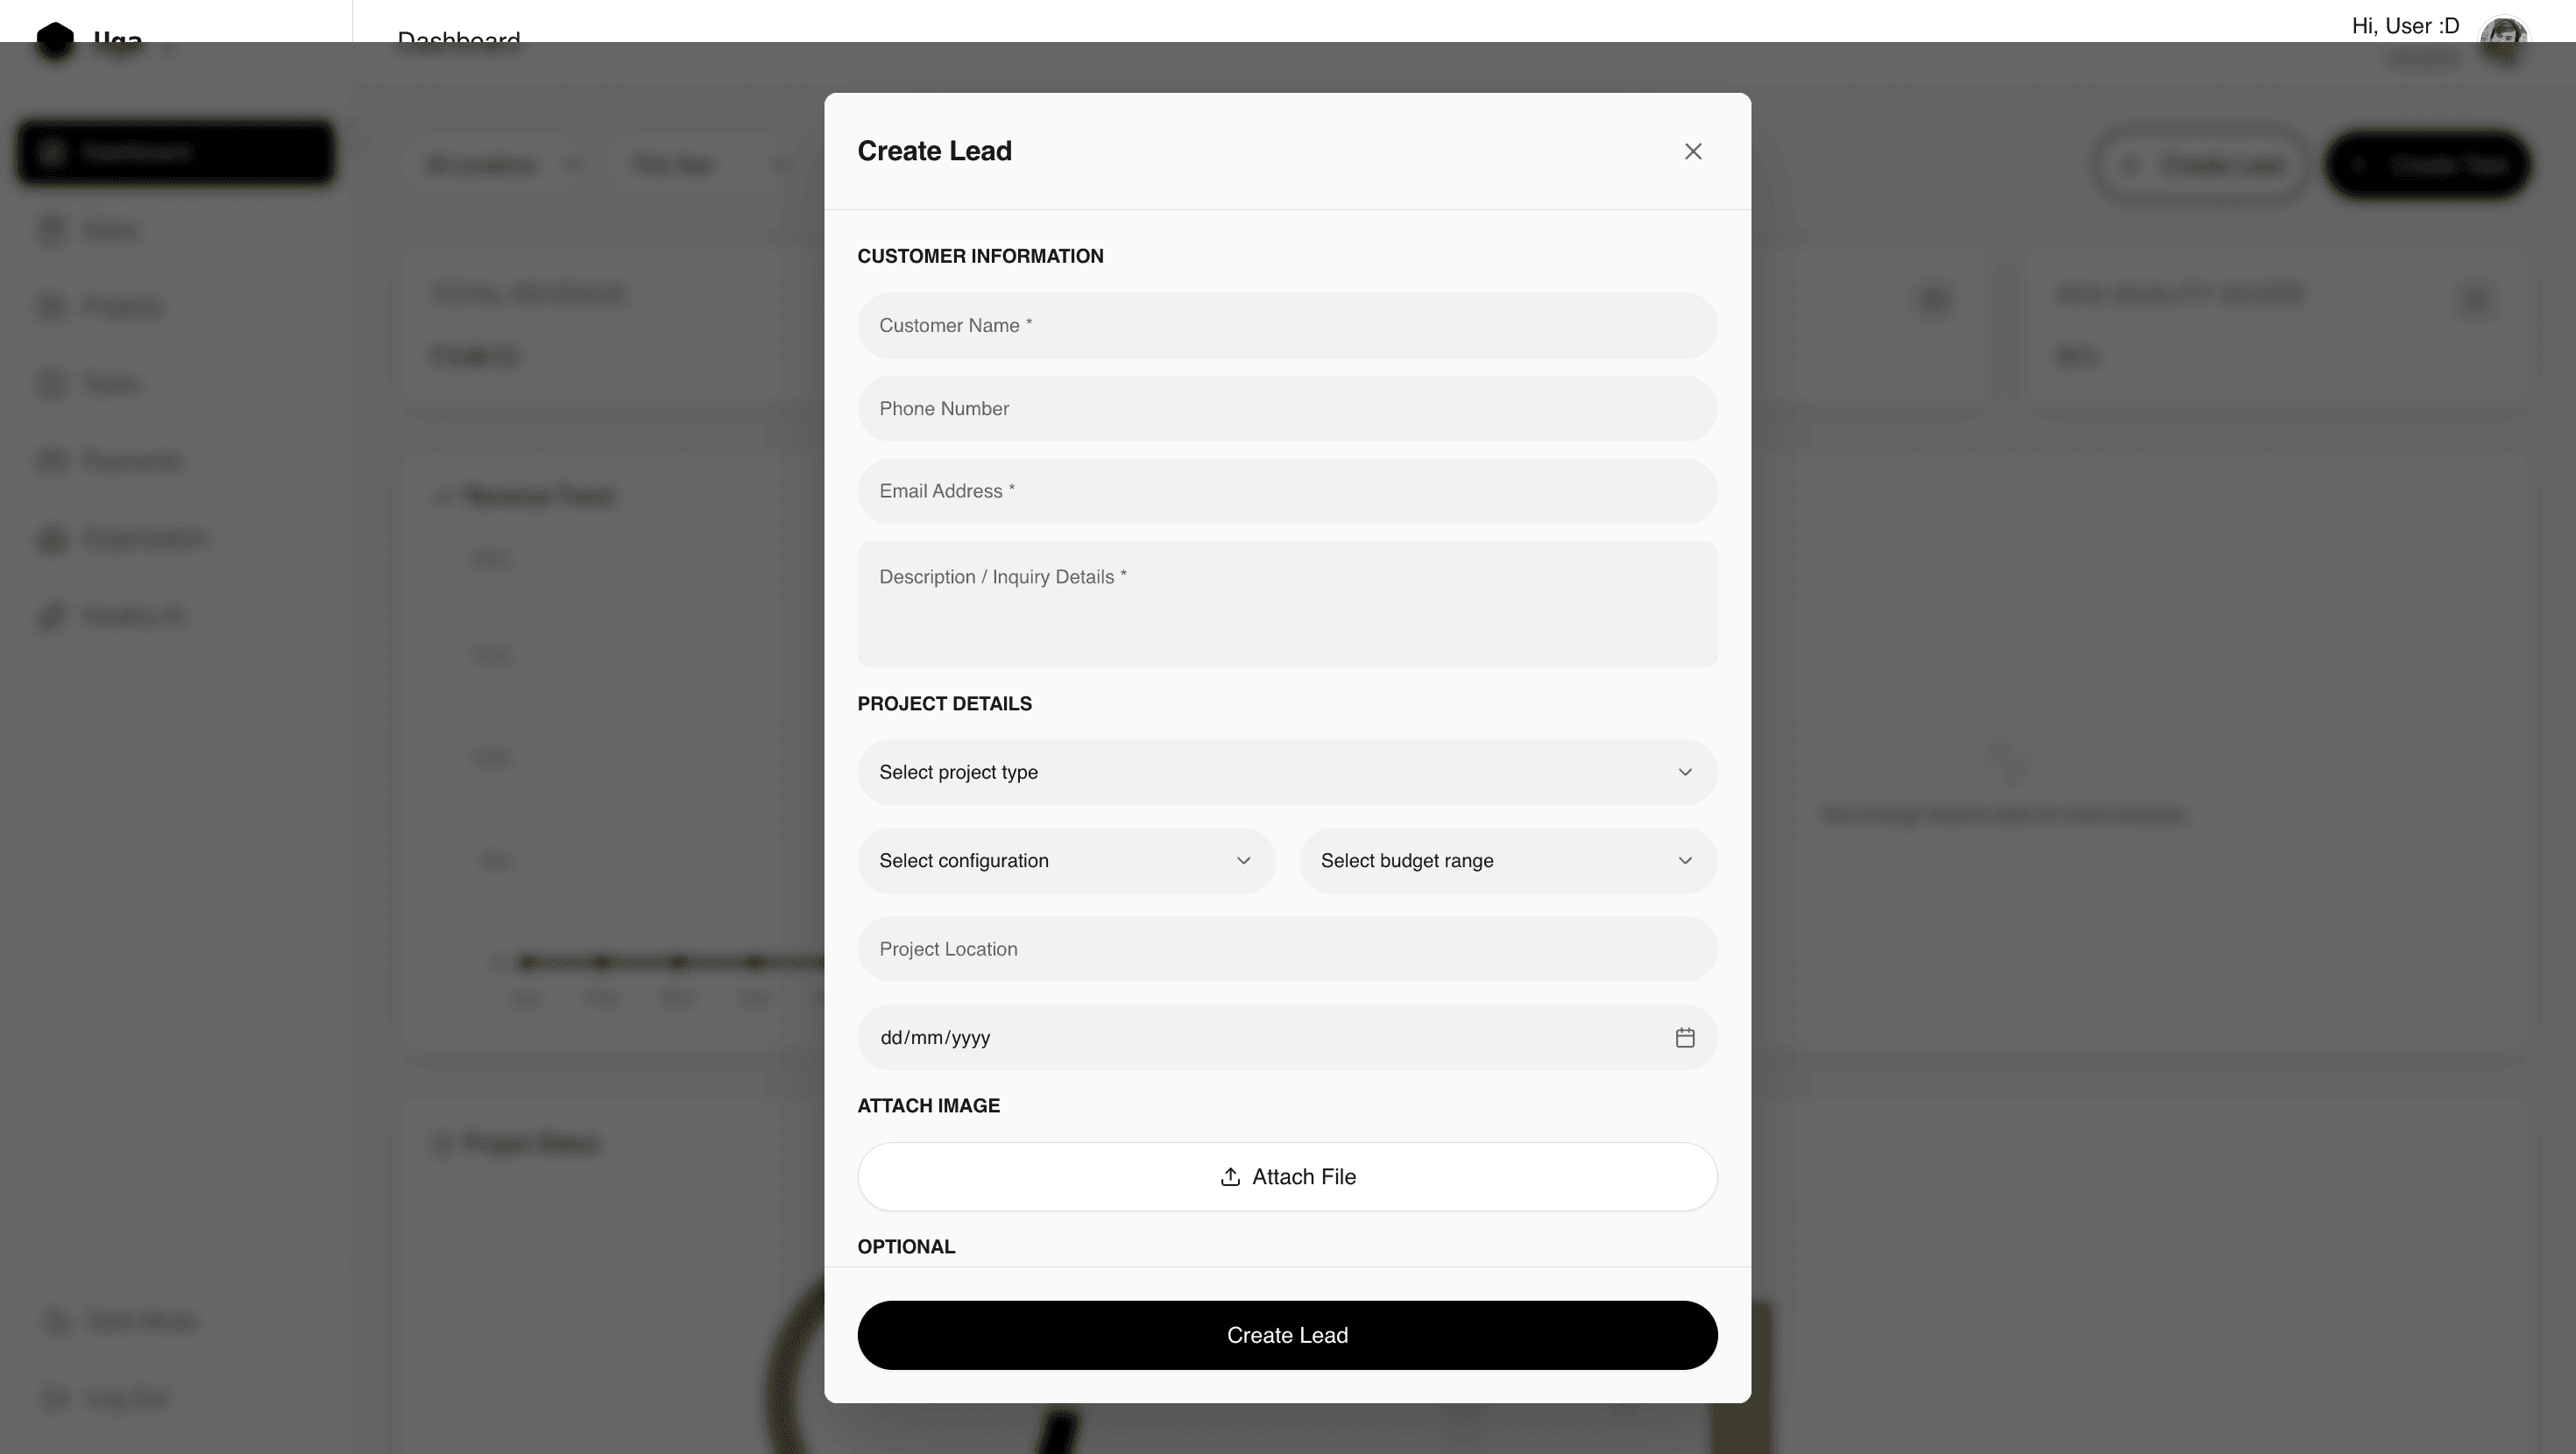
Sales
View all deals
→
Track stage movement
→
Identify risks and priorities
→
Progress or close deals

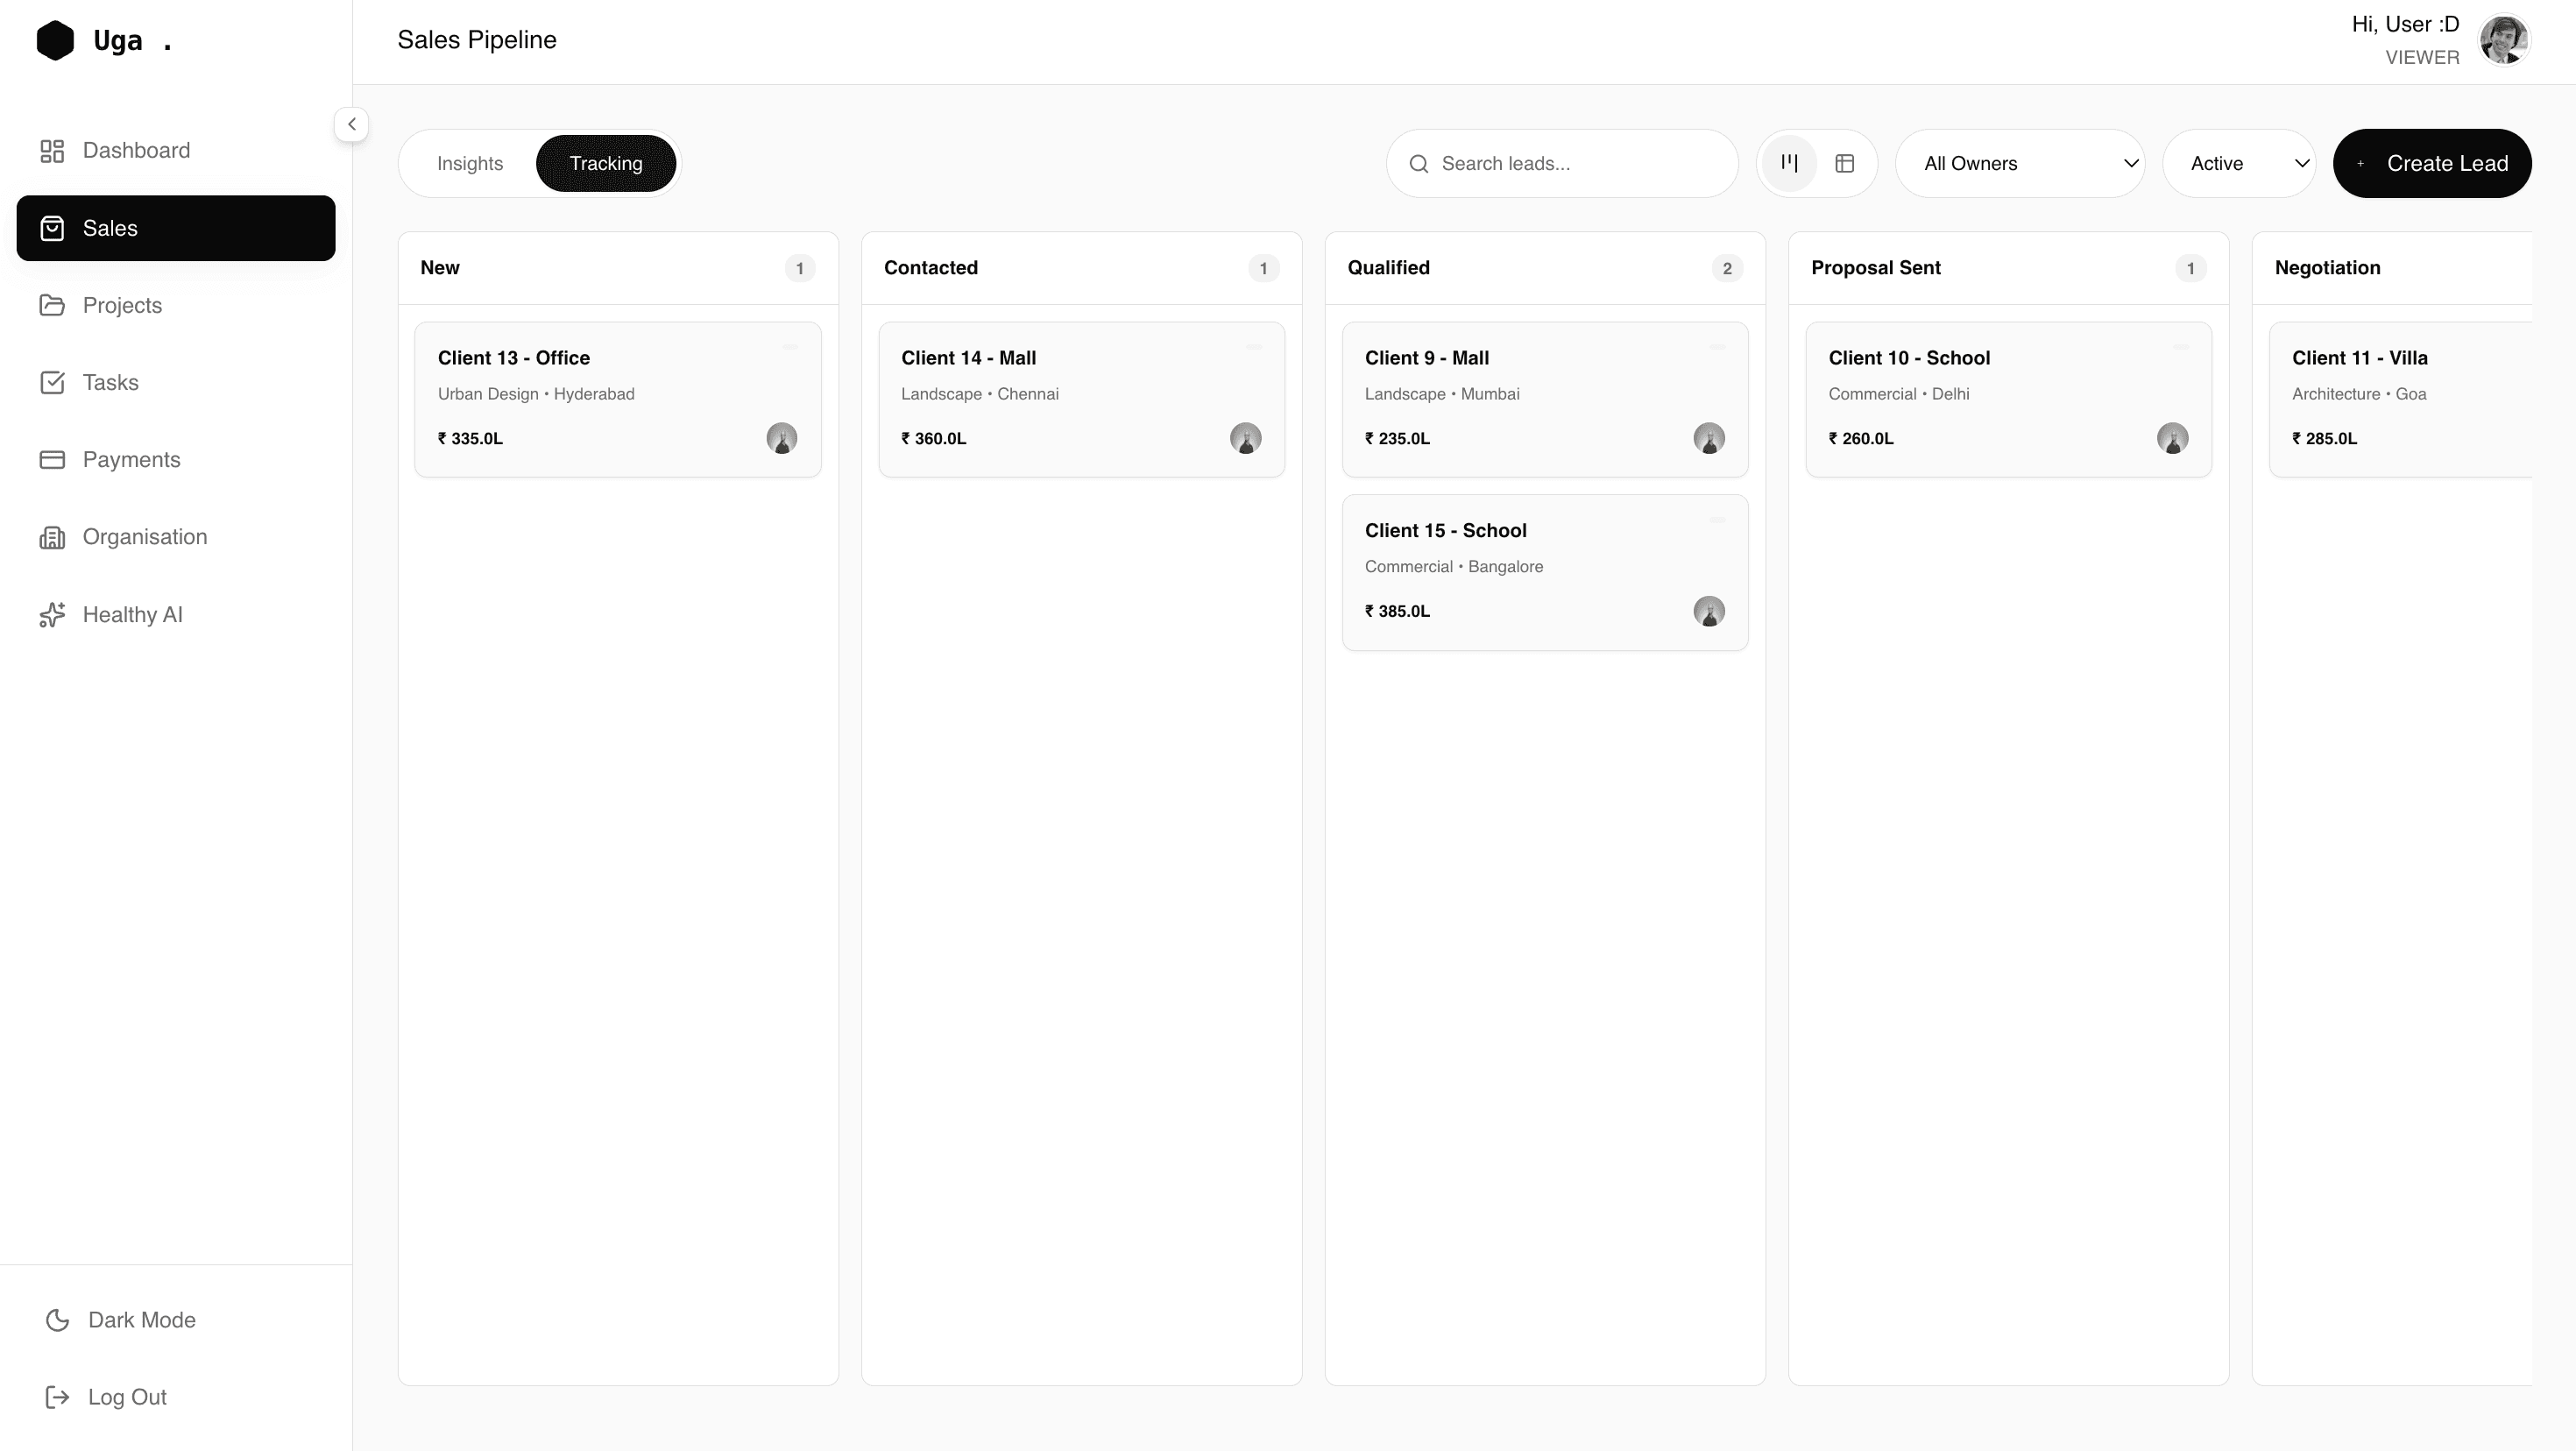
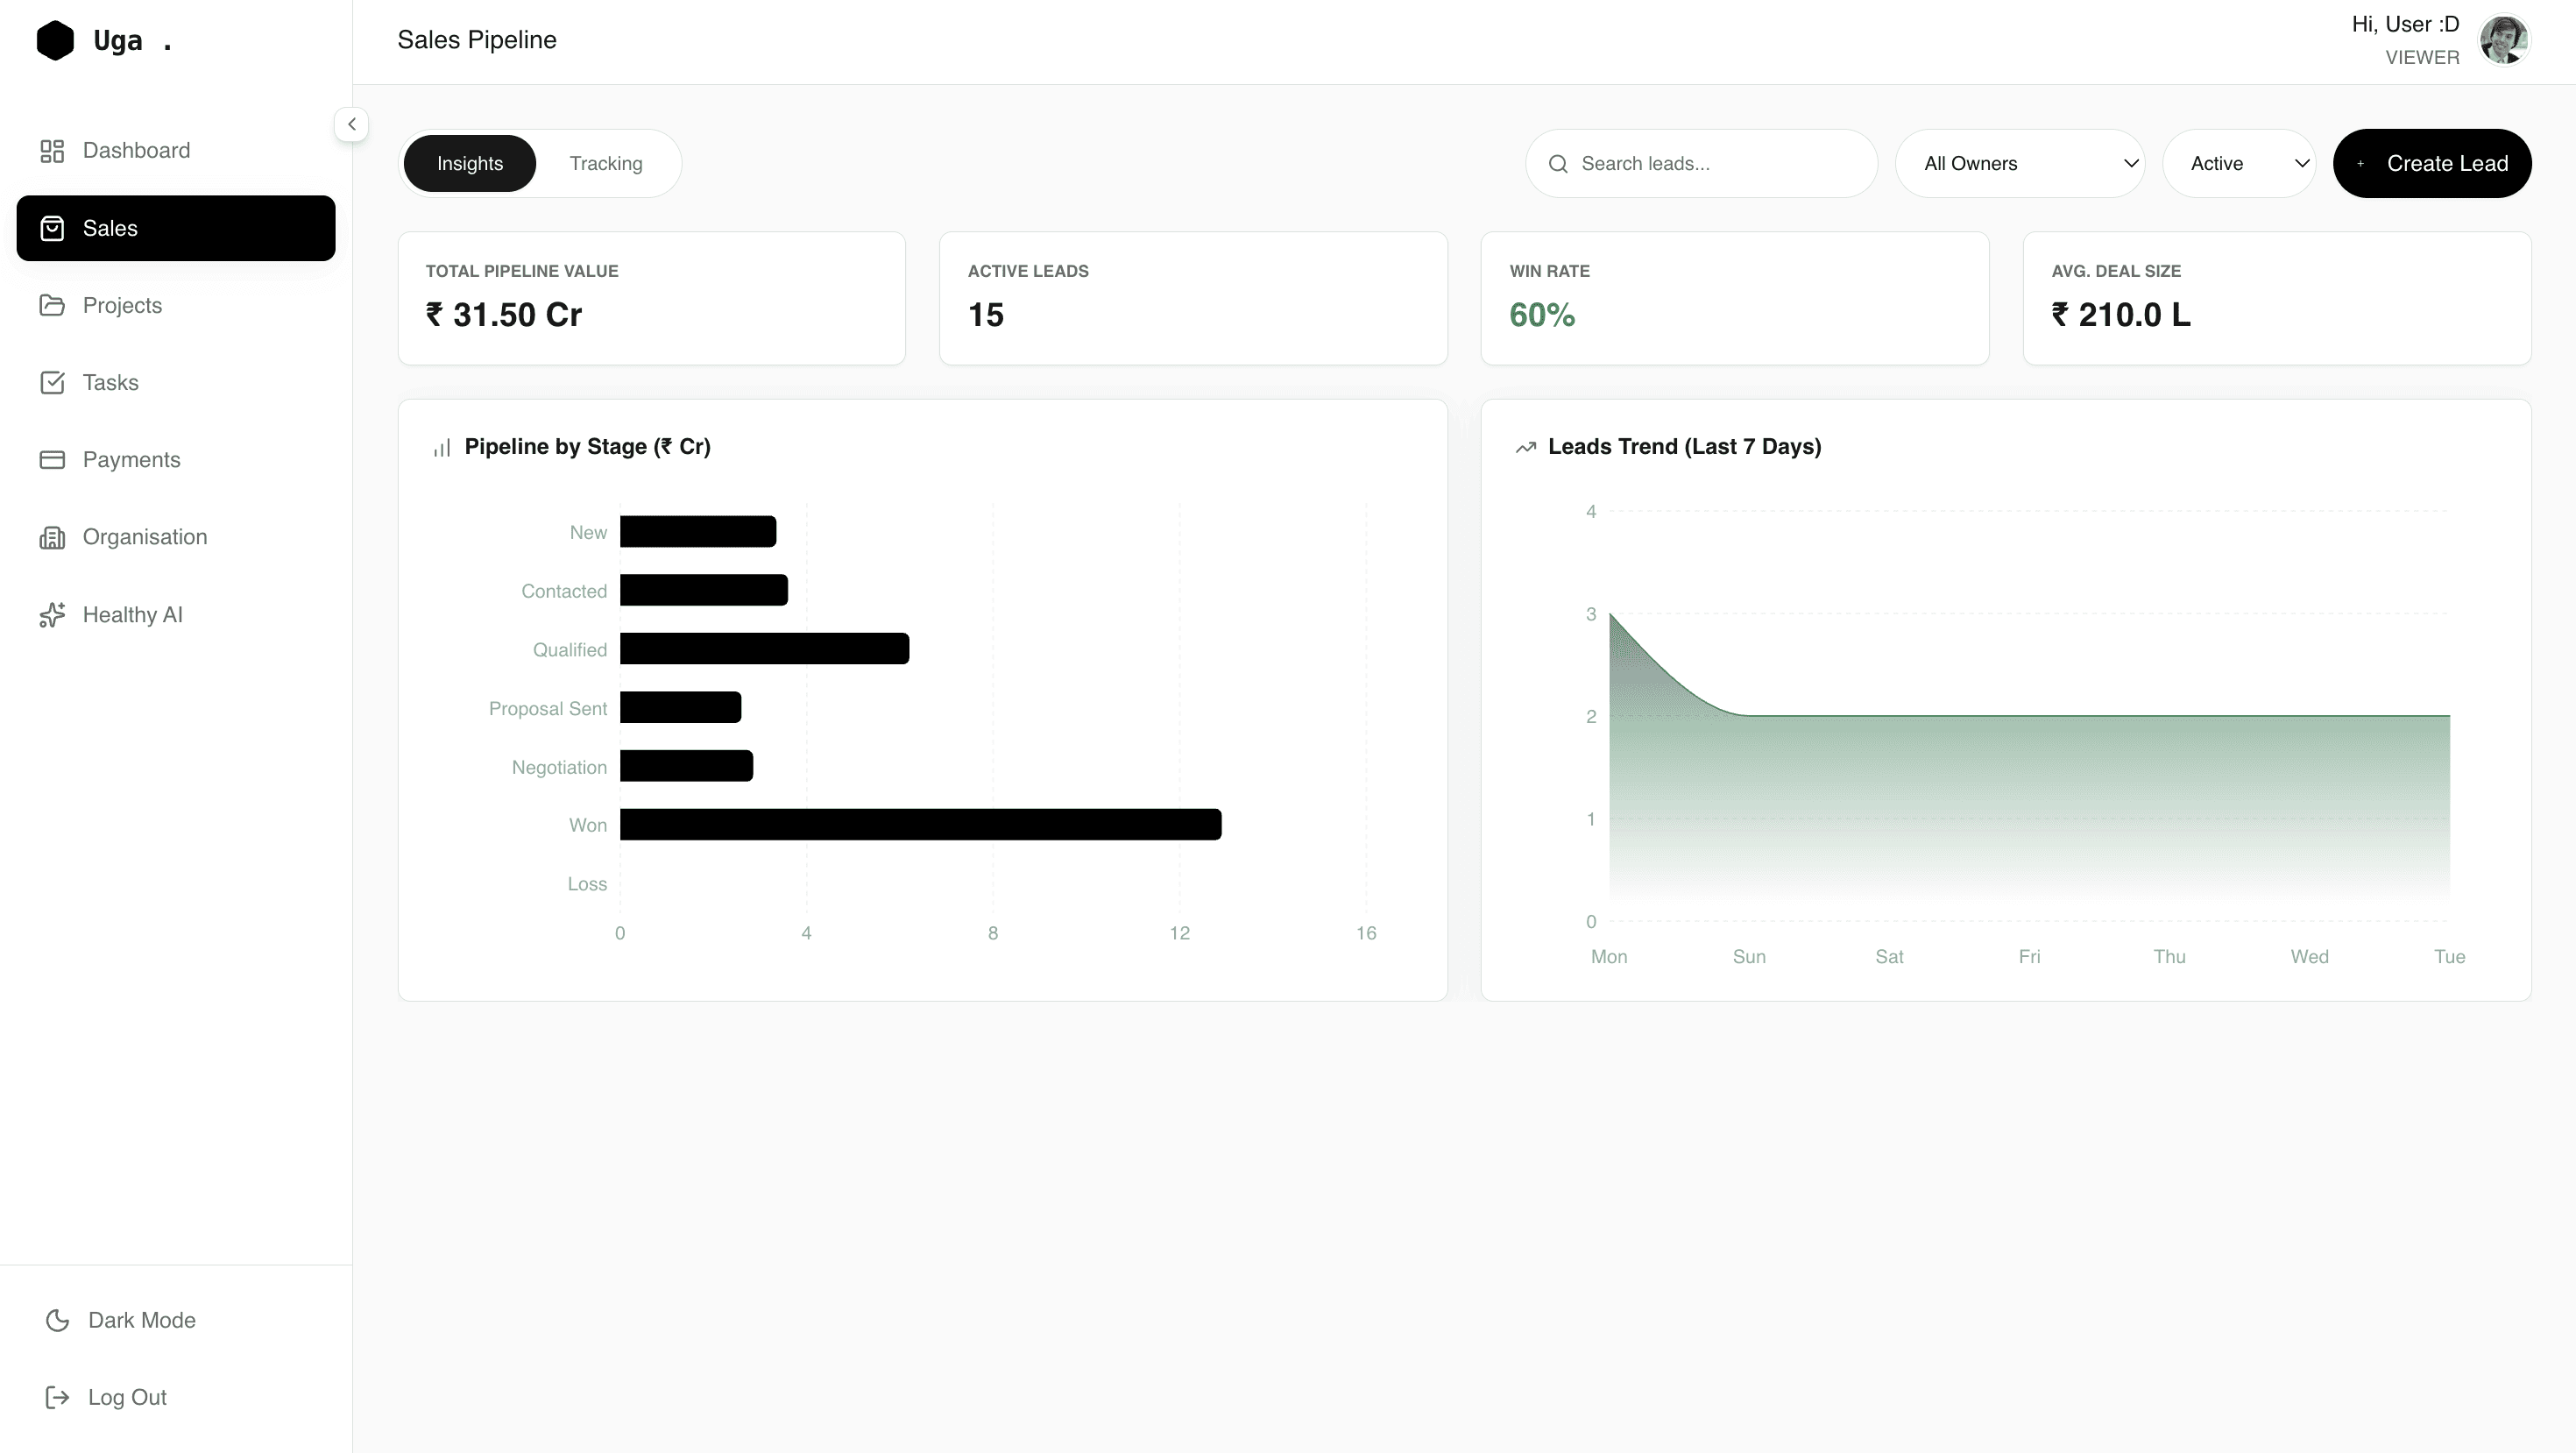
Q1. What problem does the Sales page solve?
It shows how opportunities turn into real revenue.
Q2. Why track deal stages here?
To understand progress, risk, and conversion likelihood.
Q3. What action does this page drive?
Moving deals forward or closing them.
Q1. What problem does the Sales page solve?
It shows how opportunities turn into real revenue.
Q2. Why track deal stages here?
To understand progress, risk, and conversion likelihood.
Q3. What action does this page drive?
Moving deals forward or closing them.
Projects
View all projects
→
Track progress and milestones
→
Detect risks early
→
Resolve issues
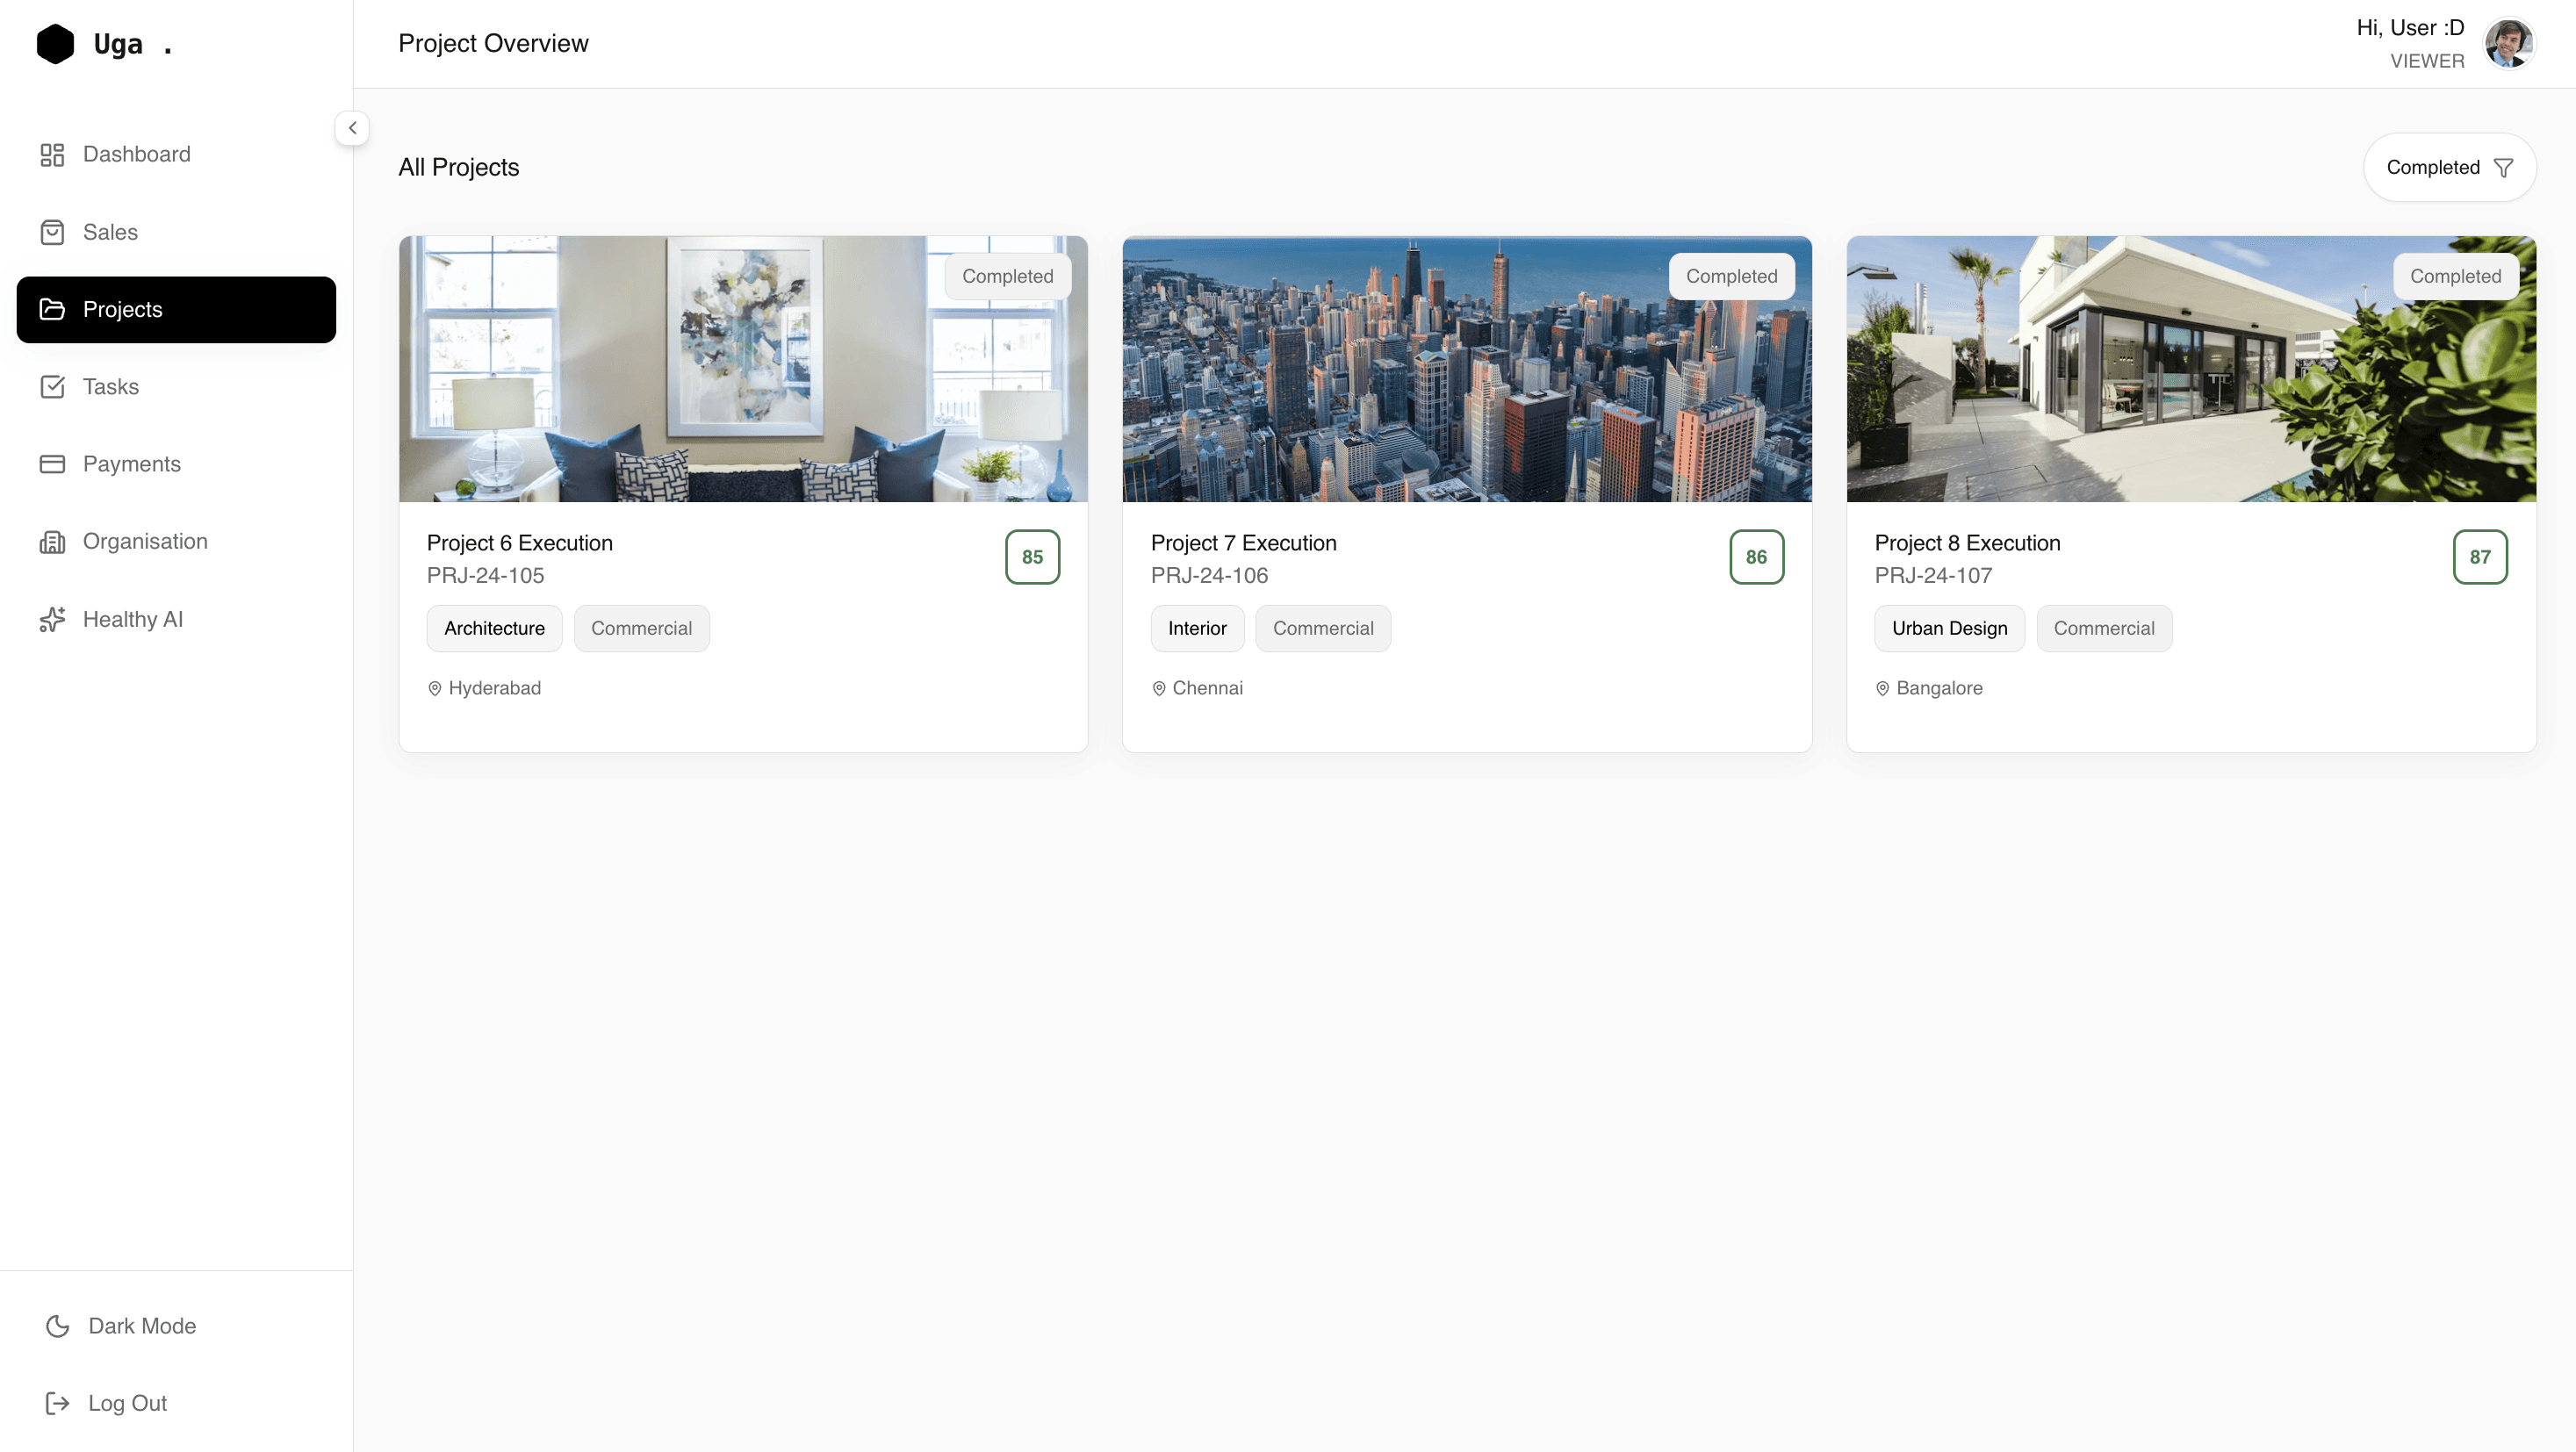
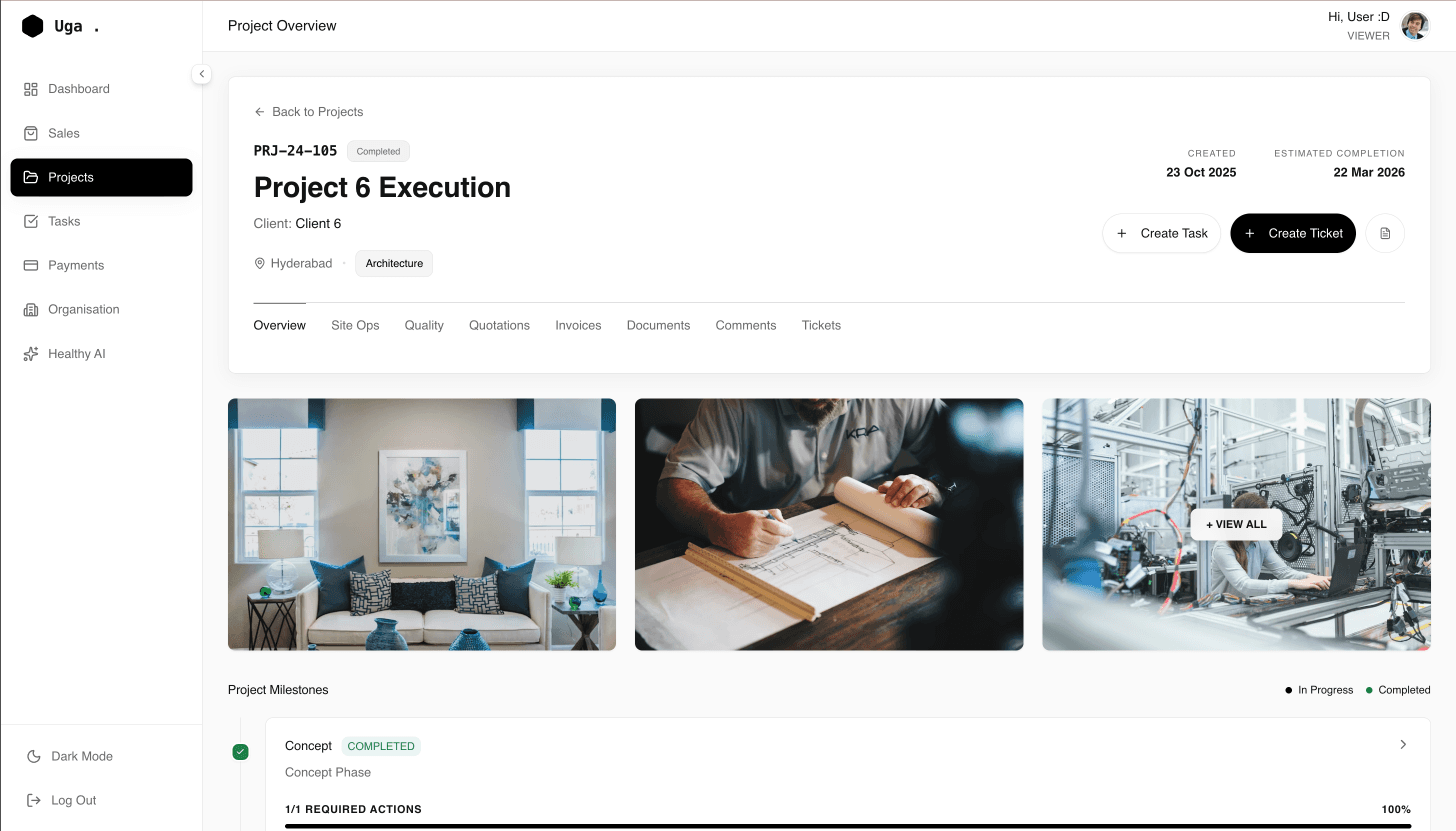
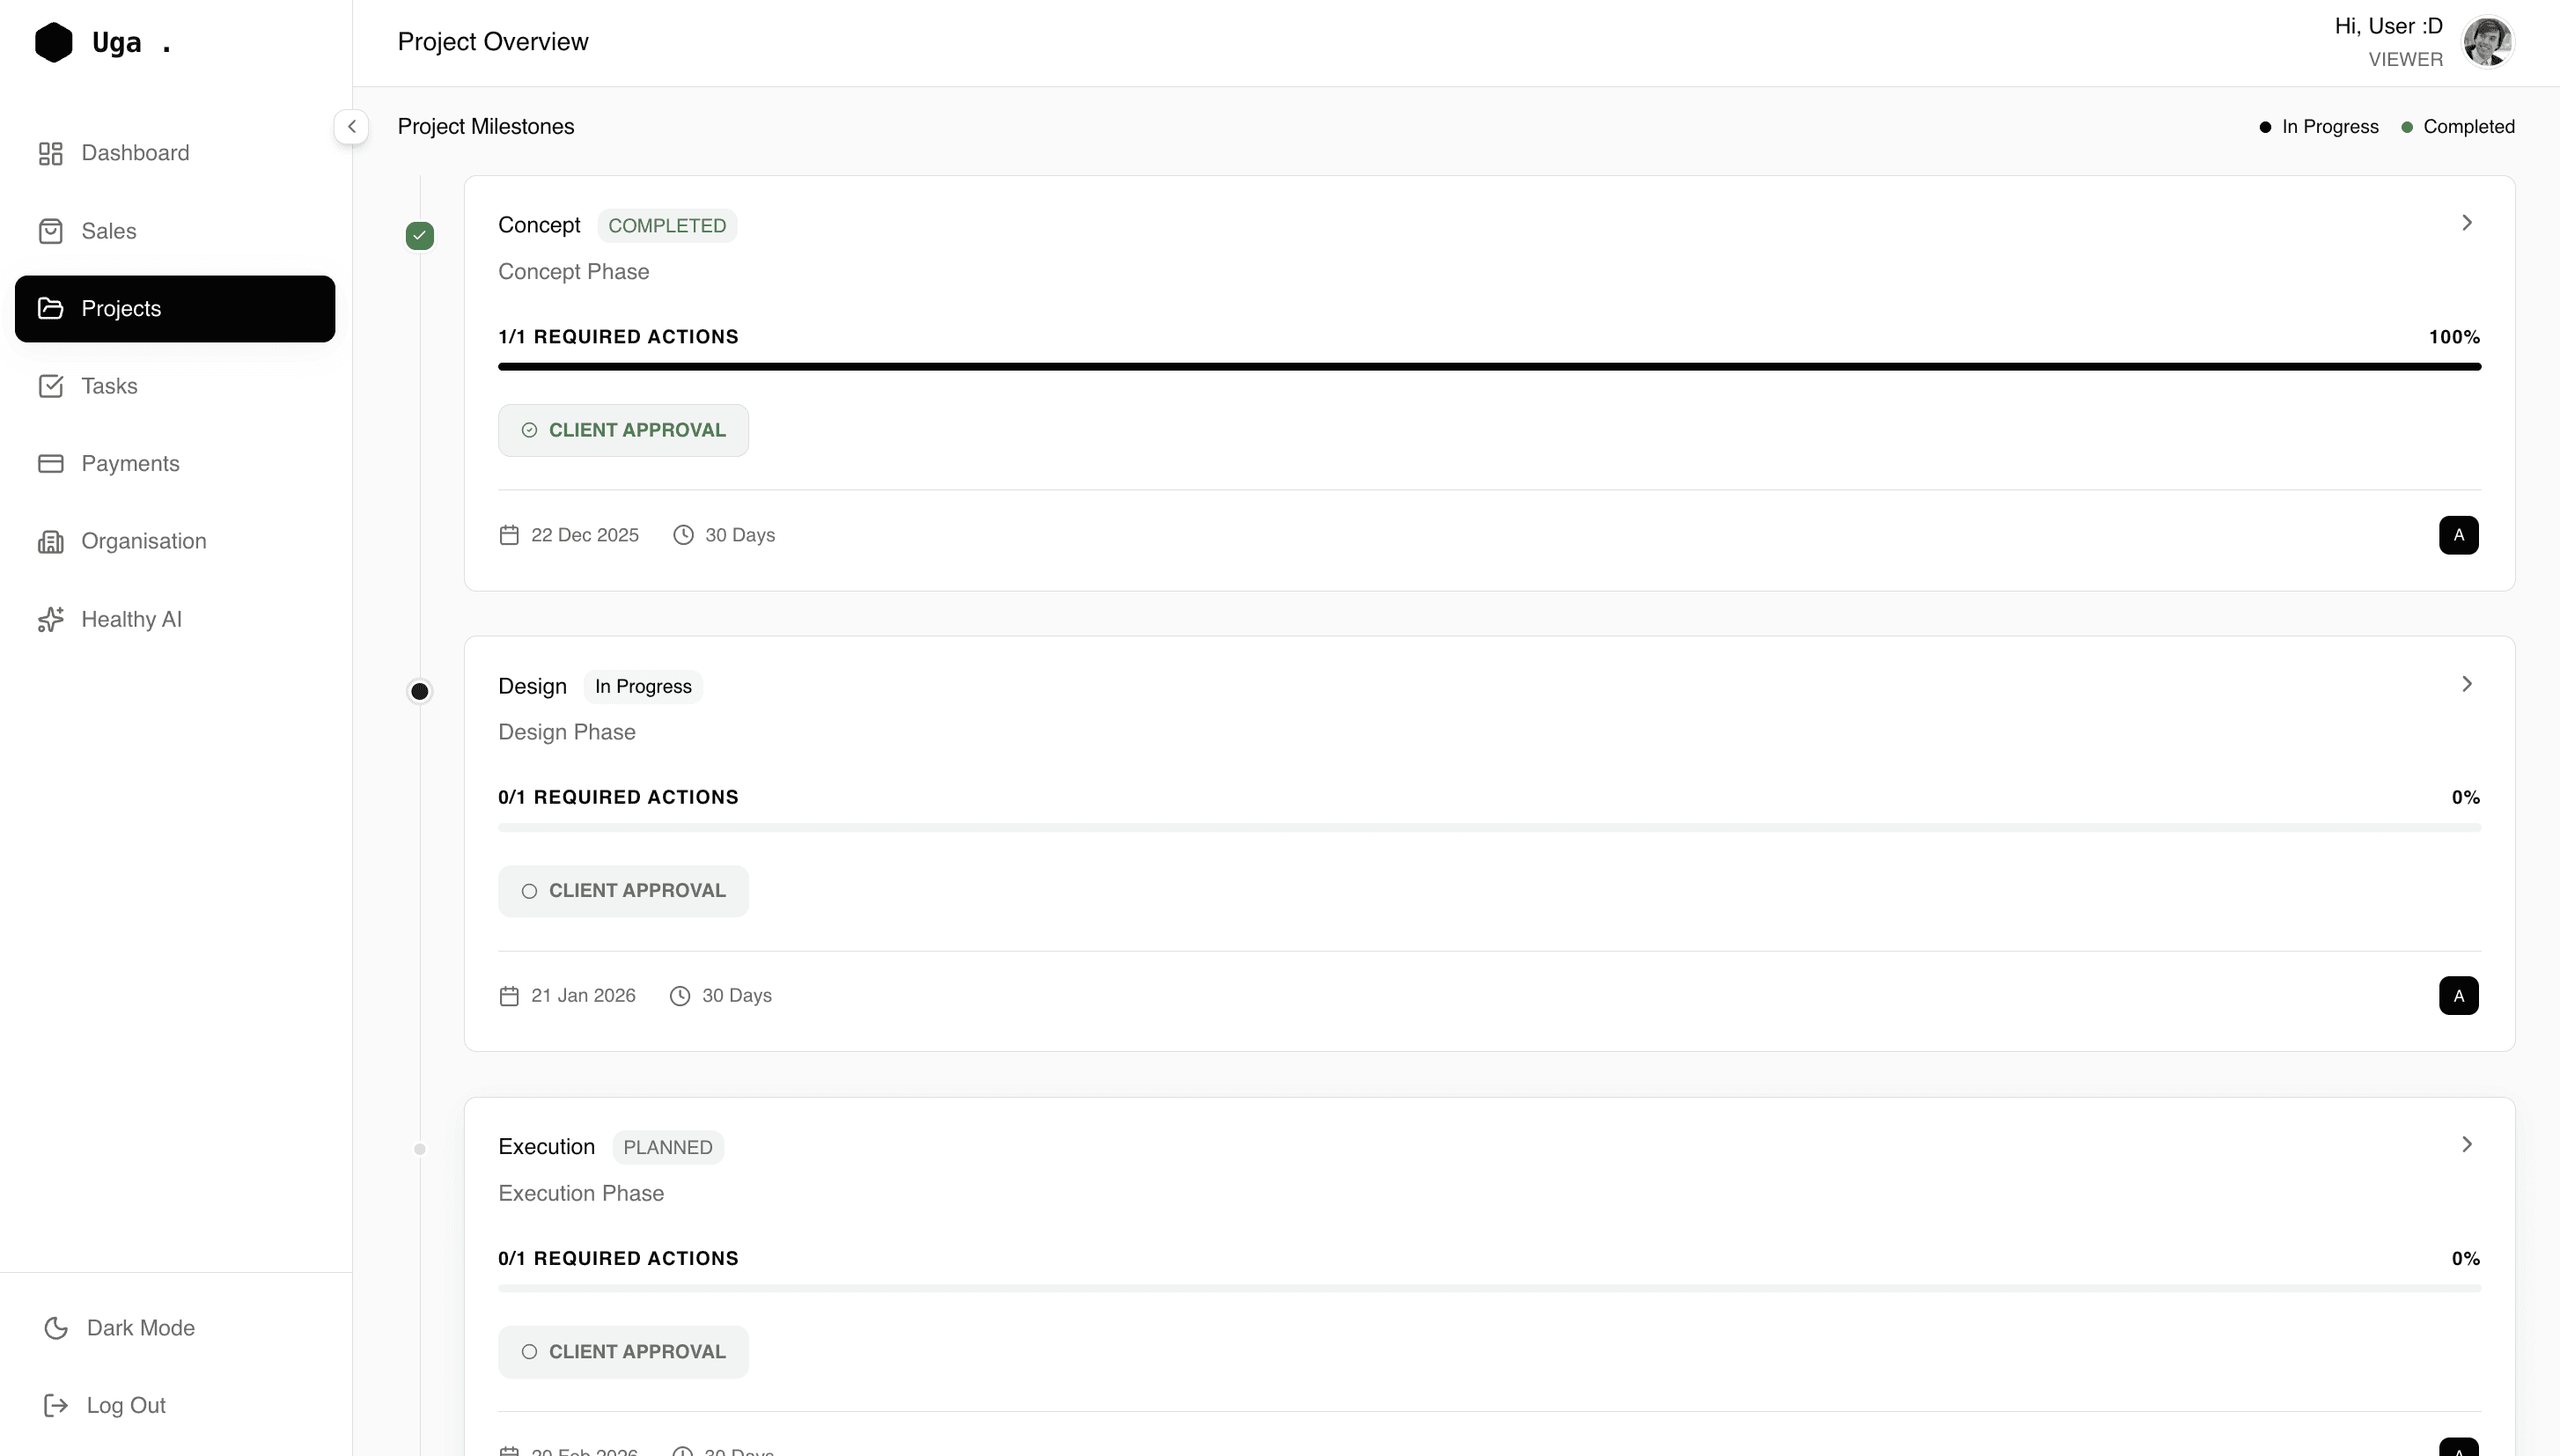
Q1. Why is this page critical post-sales?
Because delivery determines customer satisfaction and revenue realization.
Q2. What insight does this page provide?
How work is progressing and where it might fail.
Q3. What decision does it enable?
Where to intervene to keep delivery on track.
Q1. Why is this page critical post-sales?
Because delivery determines customer satisfaction and revenue realization.
Q2. What insight does this page provide?
How work is progressing and where it might fail.
Q3. What decision does it enable?
Where to intervene to keep delivery on track.
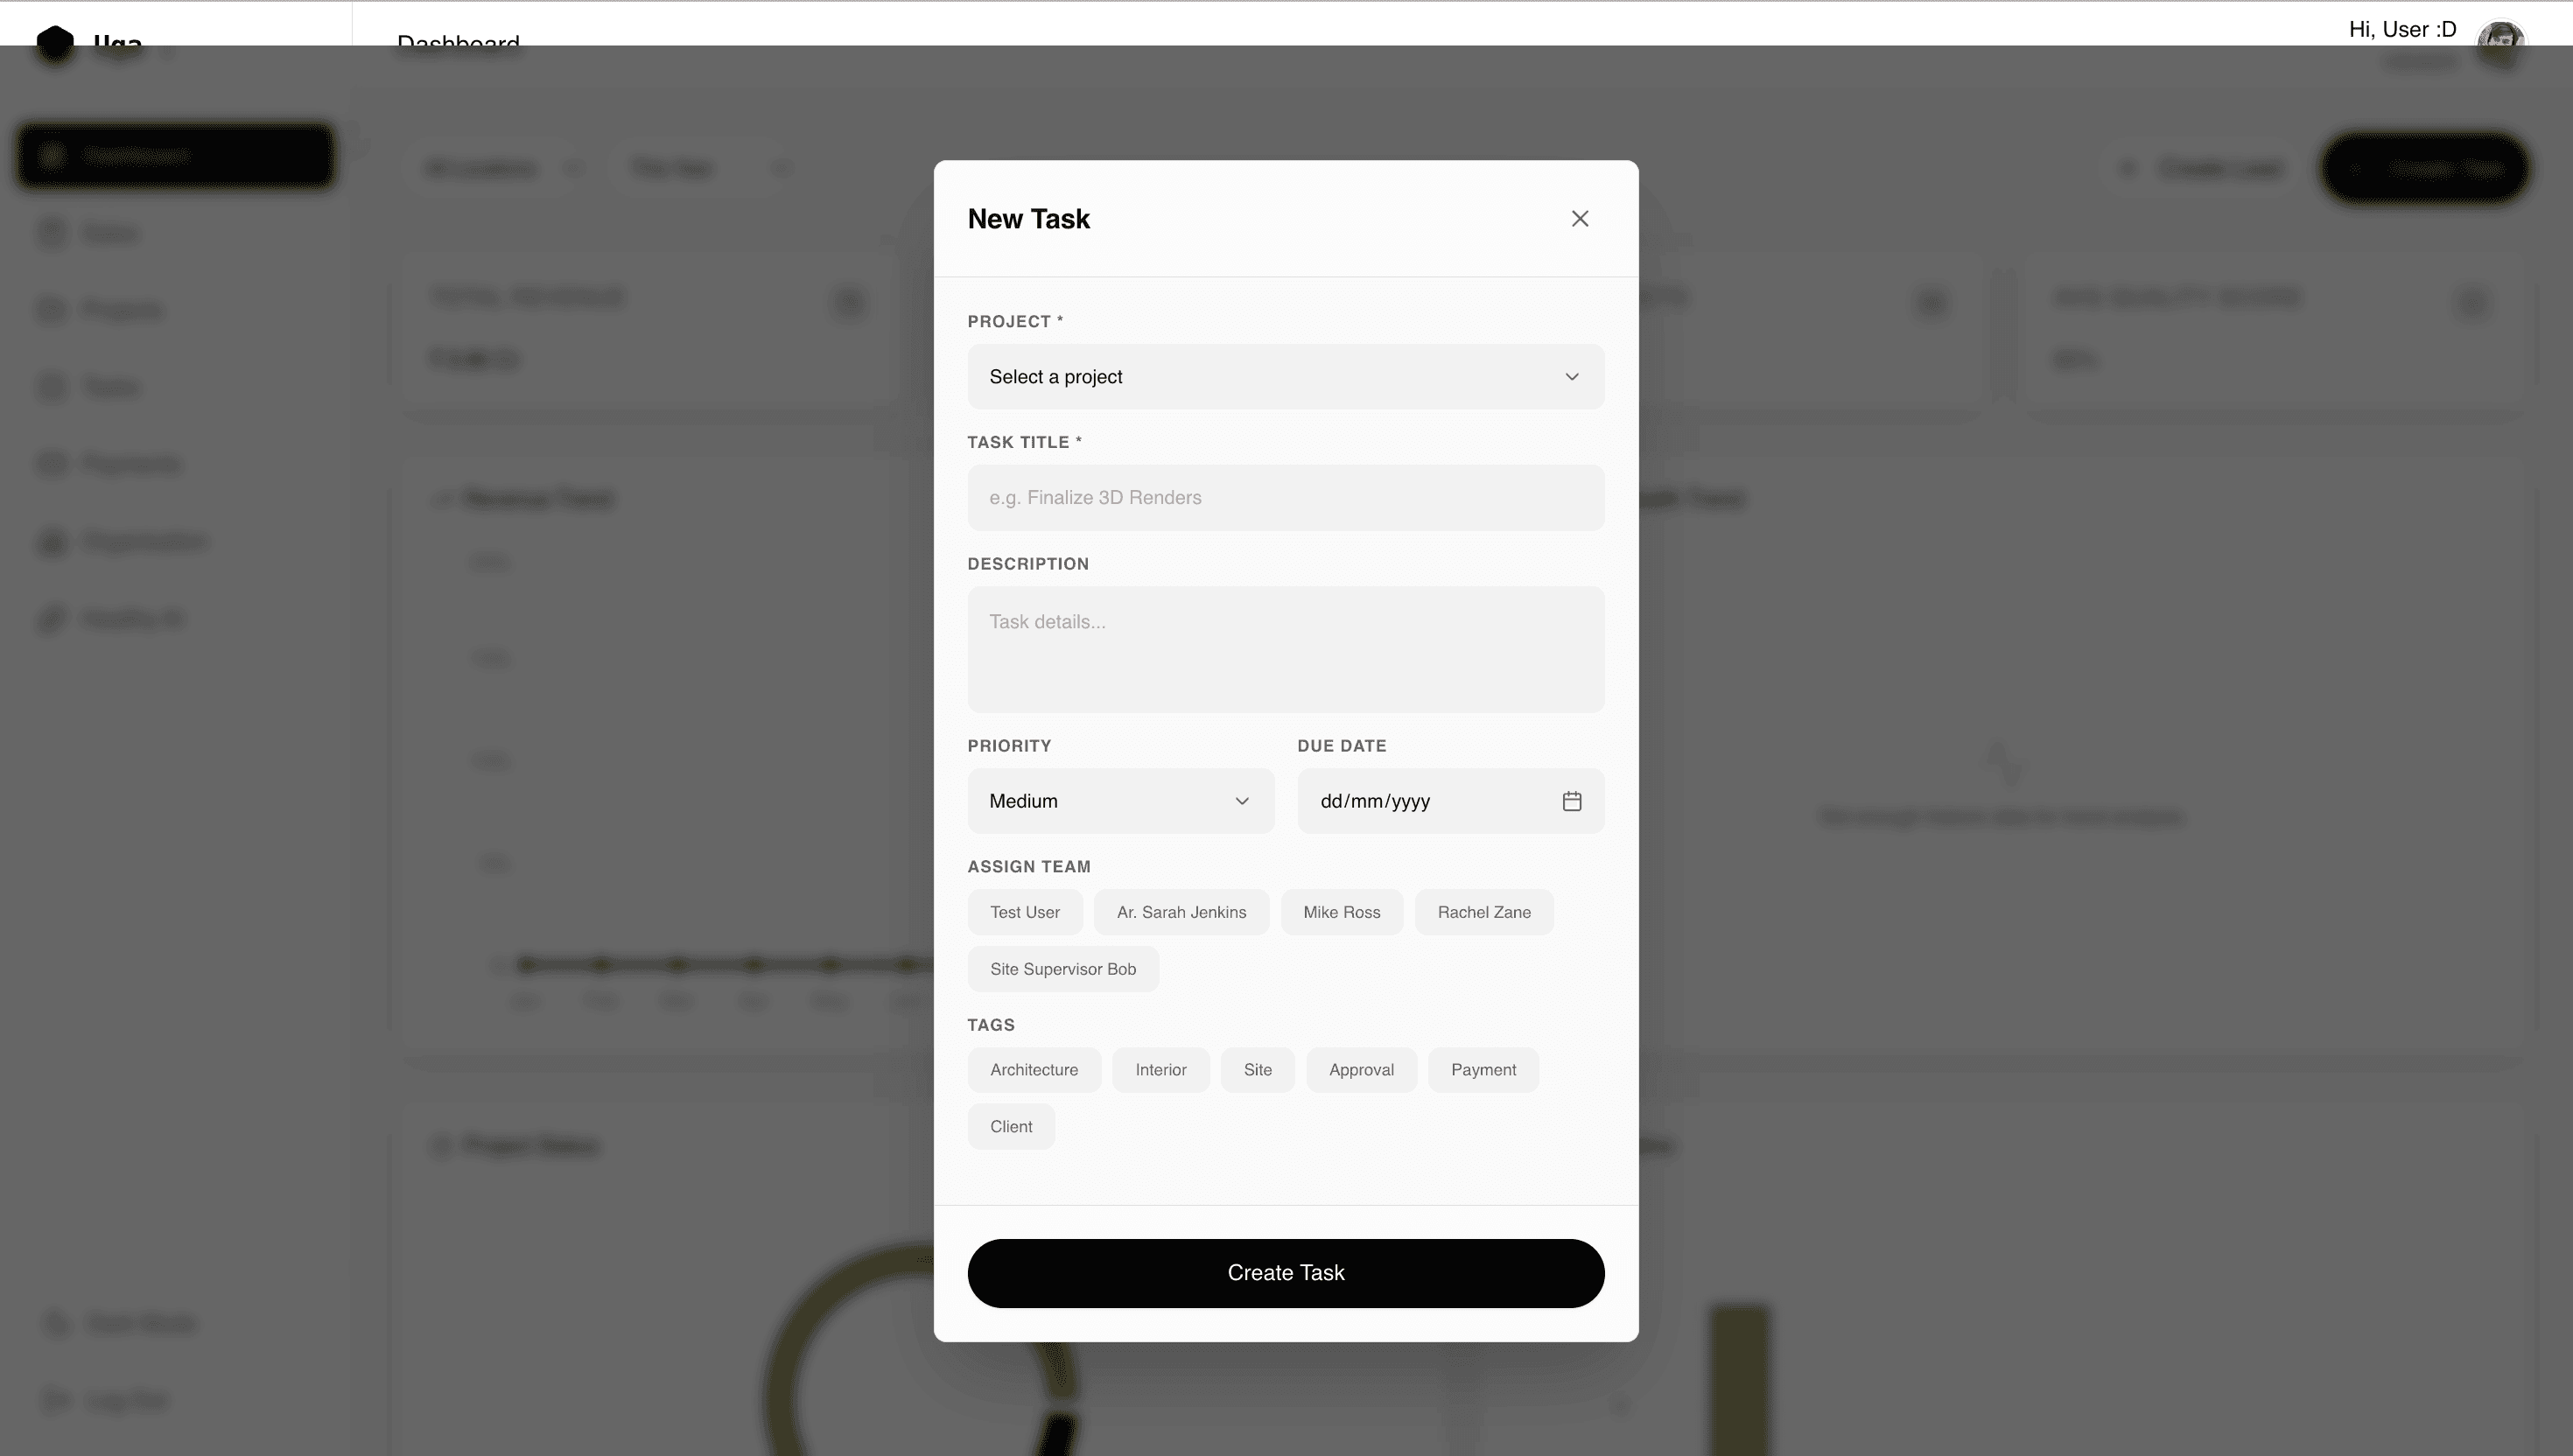
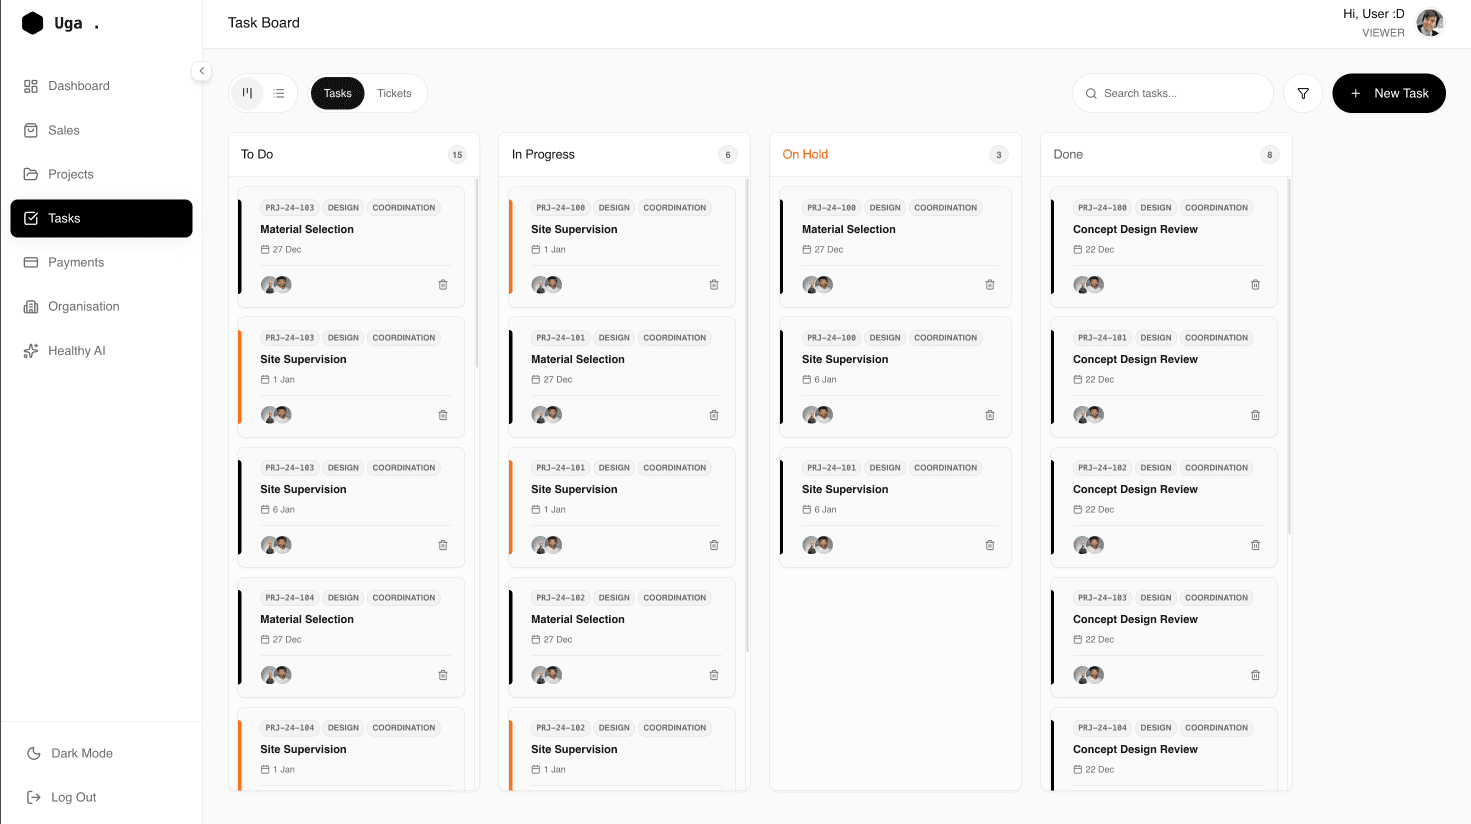
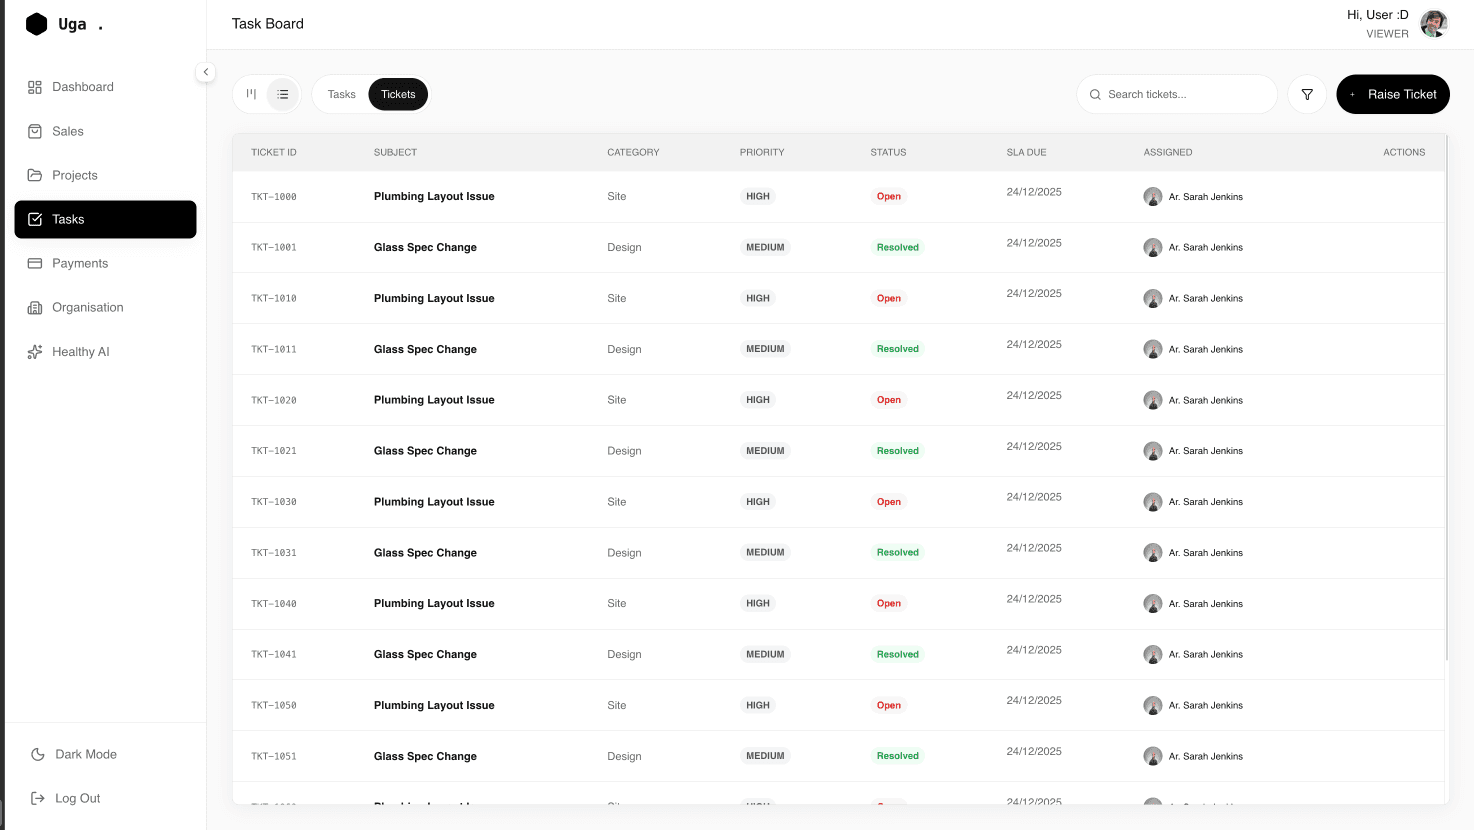
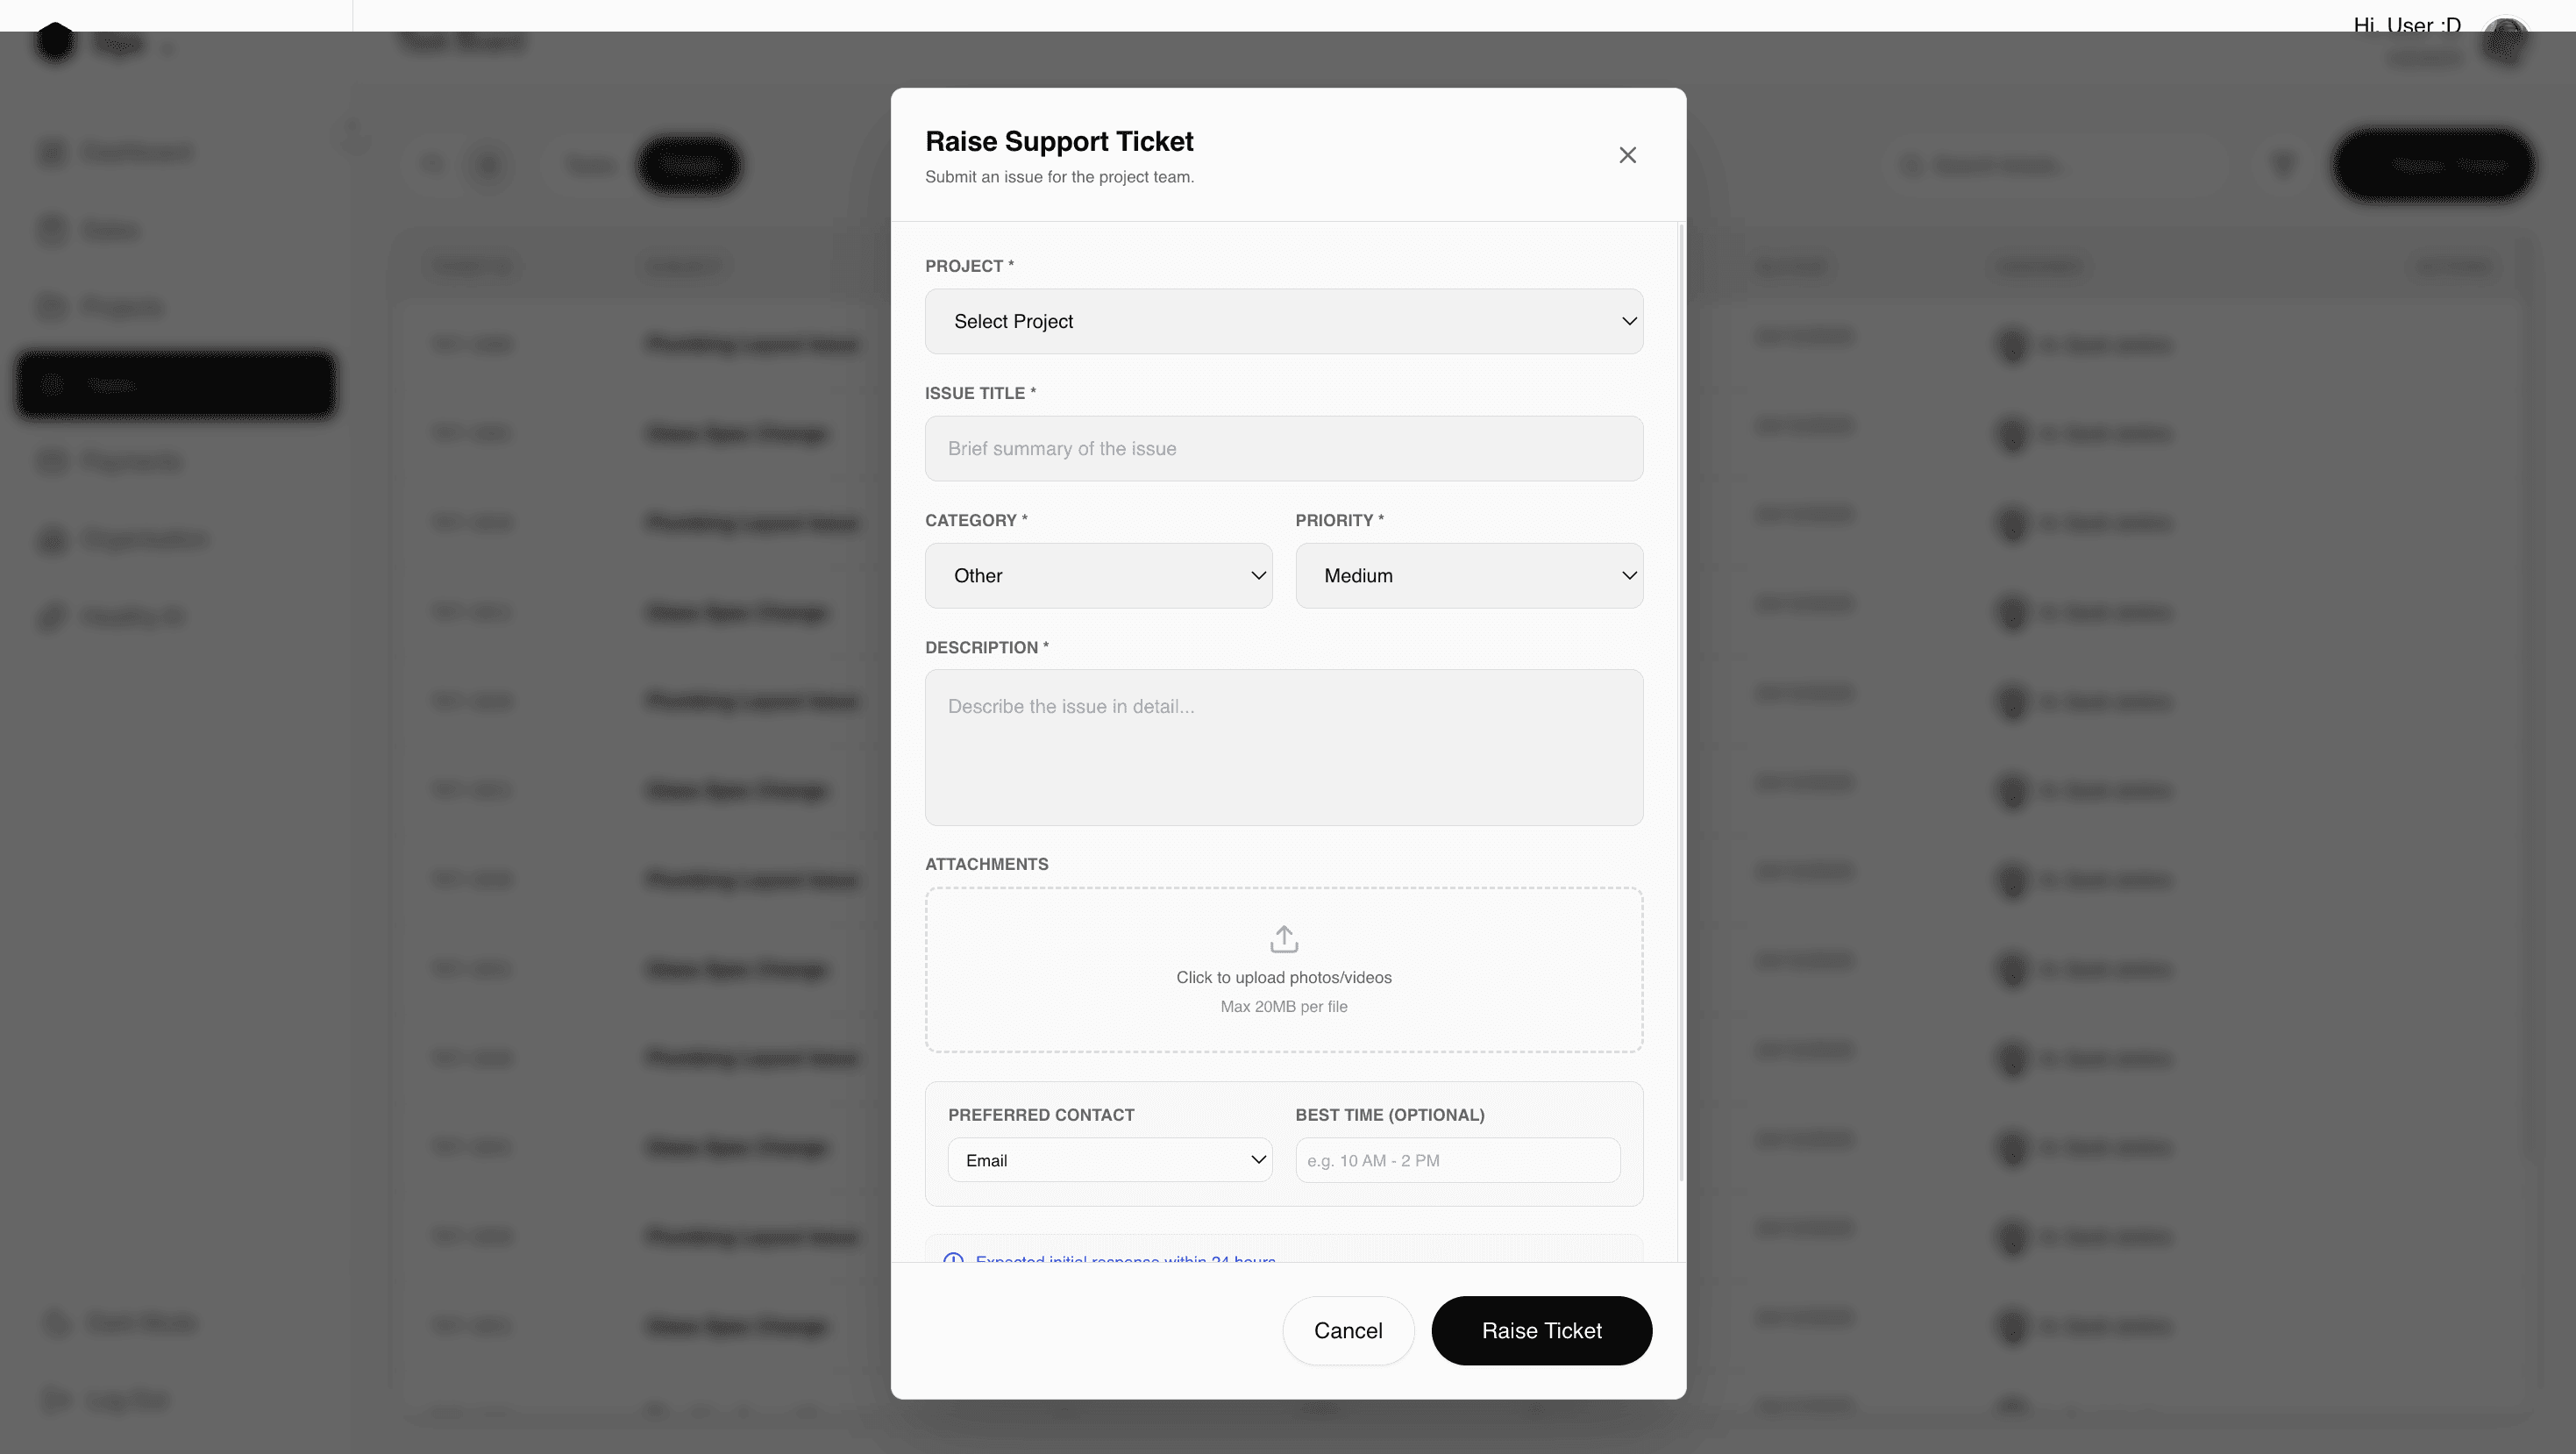
Tasks
View all tasks
→
See ownership and status
→
Spot delays
→
Update or complete work
Q1. Why is Payments part of the core flow?
Because completed work must translate into cash flow.
Q2. What risk does this page reduce?
Delayed or missed payments.
Q3. What outcome does it drive?
Faster and clearer revenue realization.
Q1. Why is Payments part of the core flow?
Because completed work must translate into cash flow.
Q2. What risk does this page reduce?
Delayed or missed payments.
Q3. What outcome does it drive?
Faster and clearer revenue realization.
Healthy AI
System observes activity
→
Detects patterns
→
Explains insights
→
Guides action
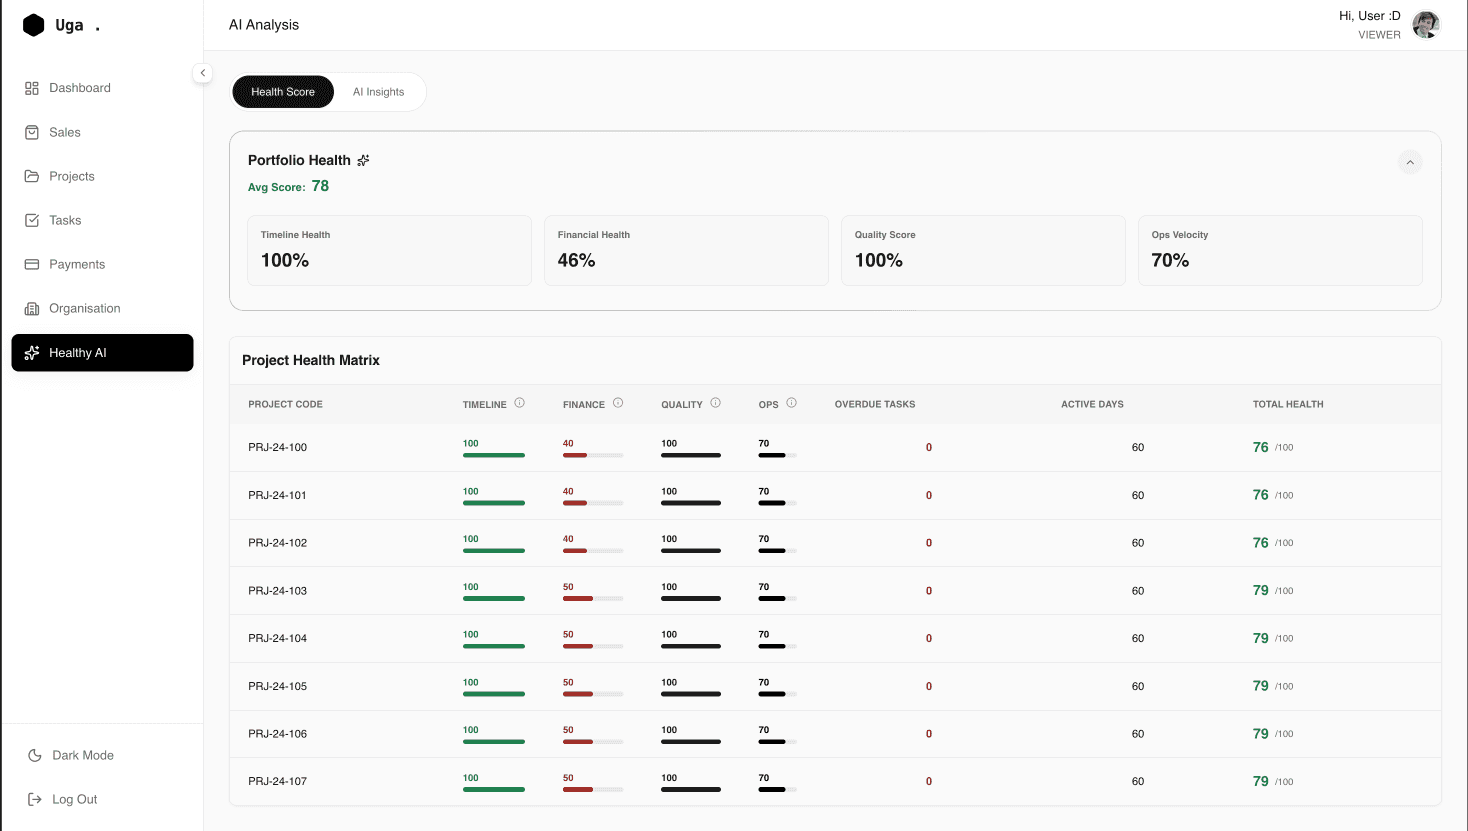
Q1. Why introduce AI here?
To surface risks and insights humans might miss.
Q2. What does the AI analyze?
Patterns across sales, projects, tasks, and payments.
Q3. How does this help the user?
By guiding attention to what matters most.
Q1. Why introduce AI here?
To surface risks and insights humans might miss.
Q2. What does the AI analyze?
Patterns across sales, projects, tasks, and payments.
Q3. How does this help the user?
By guiding attention to what matters most.
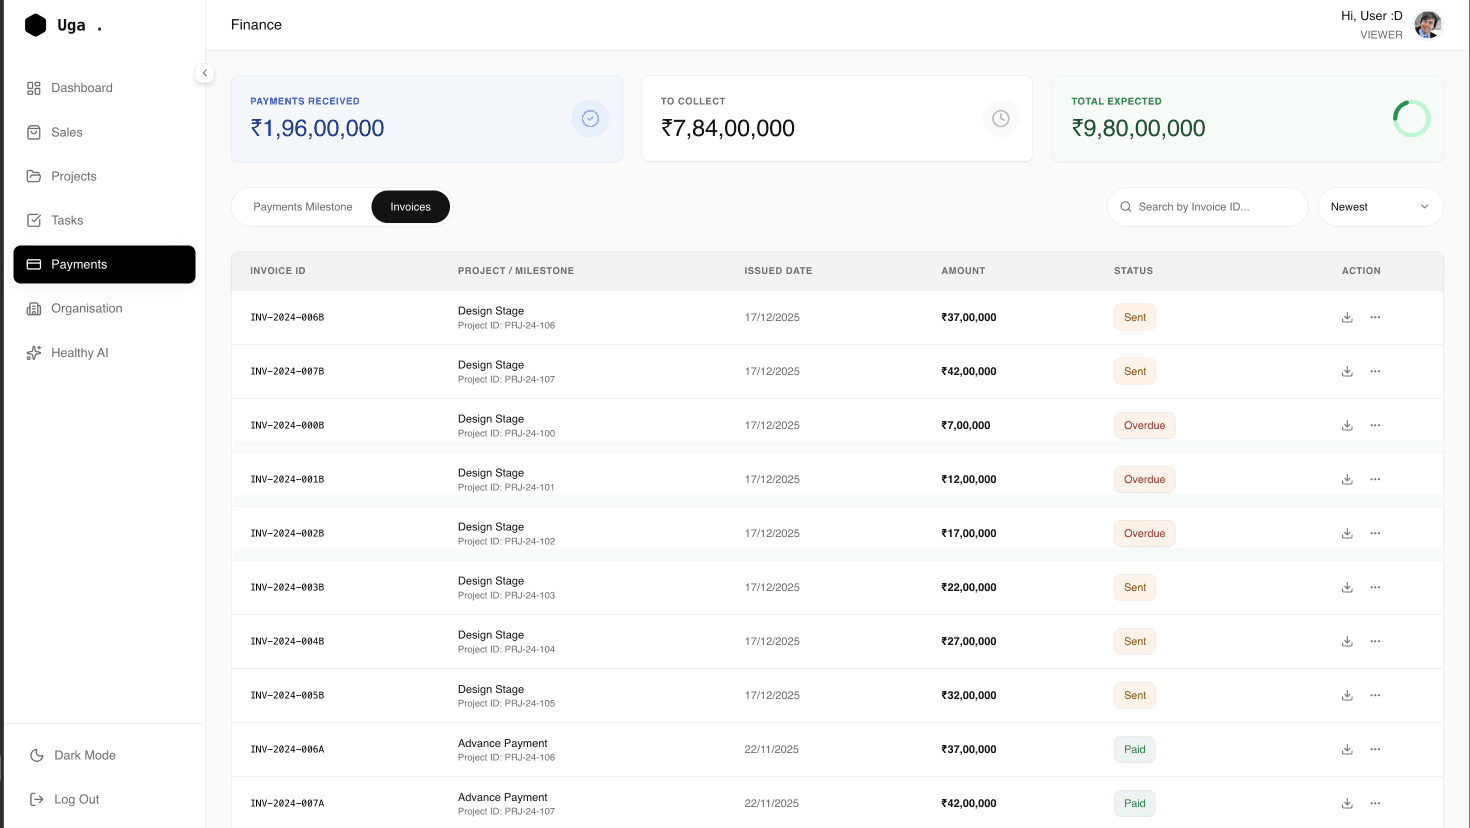
Payments
View invoices and milestones
→
Check payment status
→
Identify revenue risk
→
Follow up to unlock payments
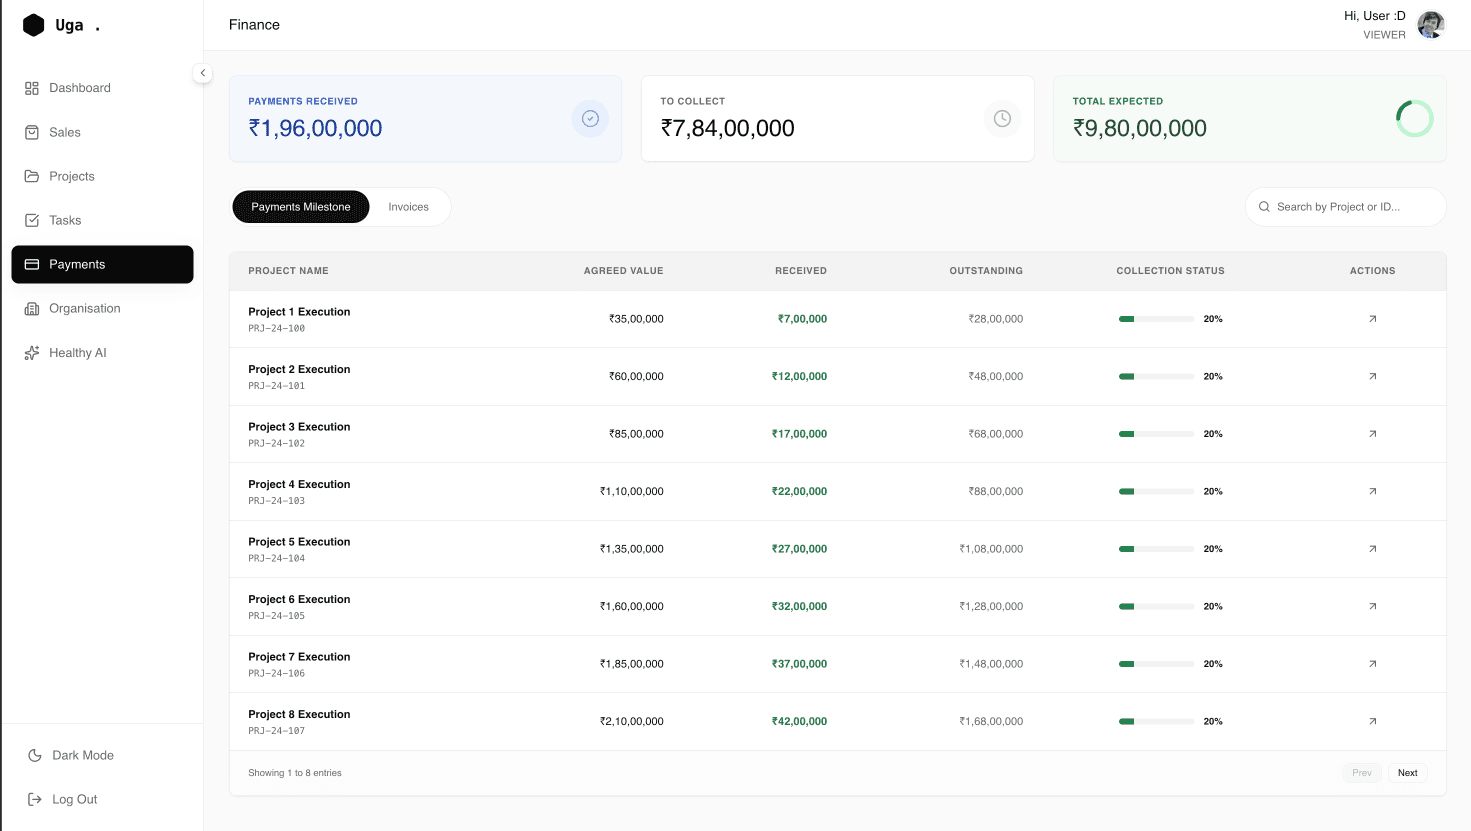
Q1. Why is Payments part of the core flow?
Because completed work must translate into cash flow.
Q2. What risk does this page reduce?
Delayed or missed payments.
Q3. What outcome does it drive?
Faster and clearer revenue realization.
Q1. Why is Payments part of the core flow?
Because completed work must translate into cash flow.
Q2. What risk does this page reduce?
Delayed or missed payments.
Q3. What outcome does it drive?
Faster and clearer revenue realization.
Organisation
View org structure
→
Review permissions
→
Manage roles
→
Scale safely
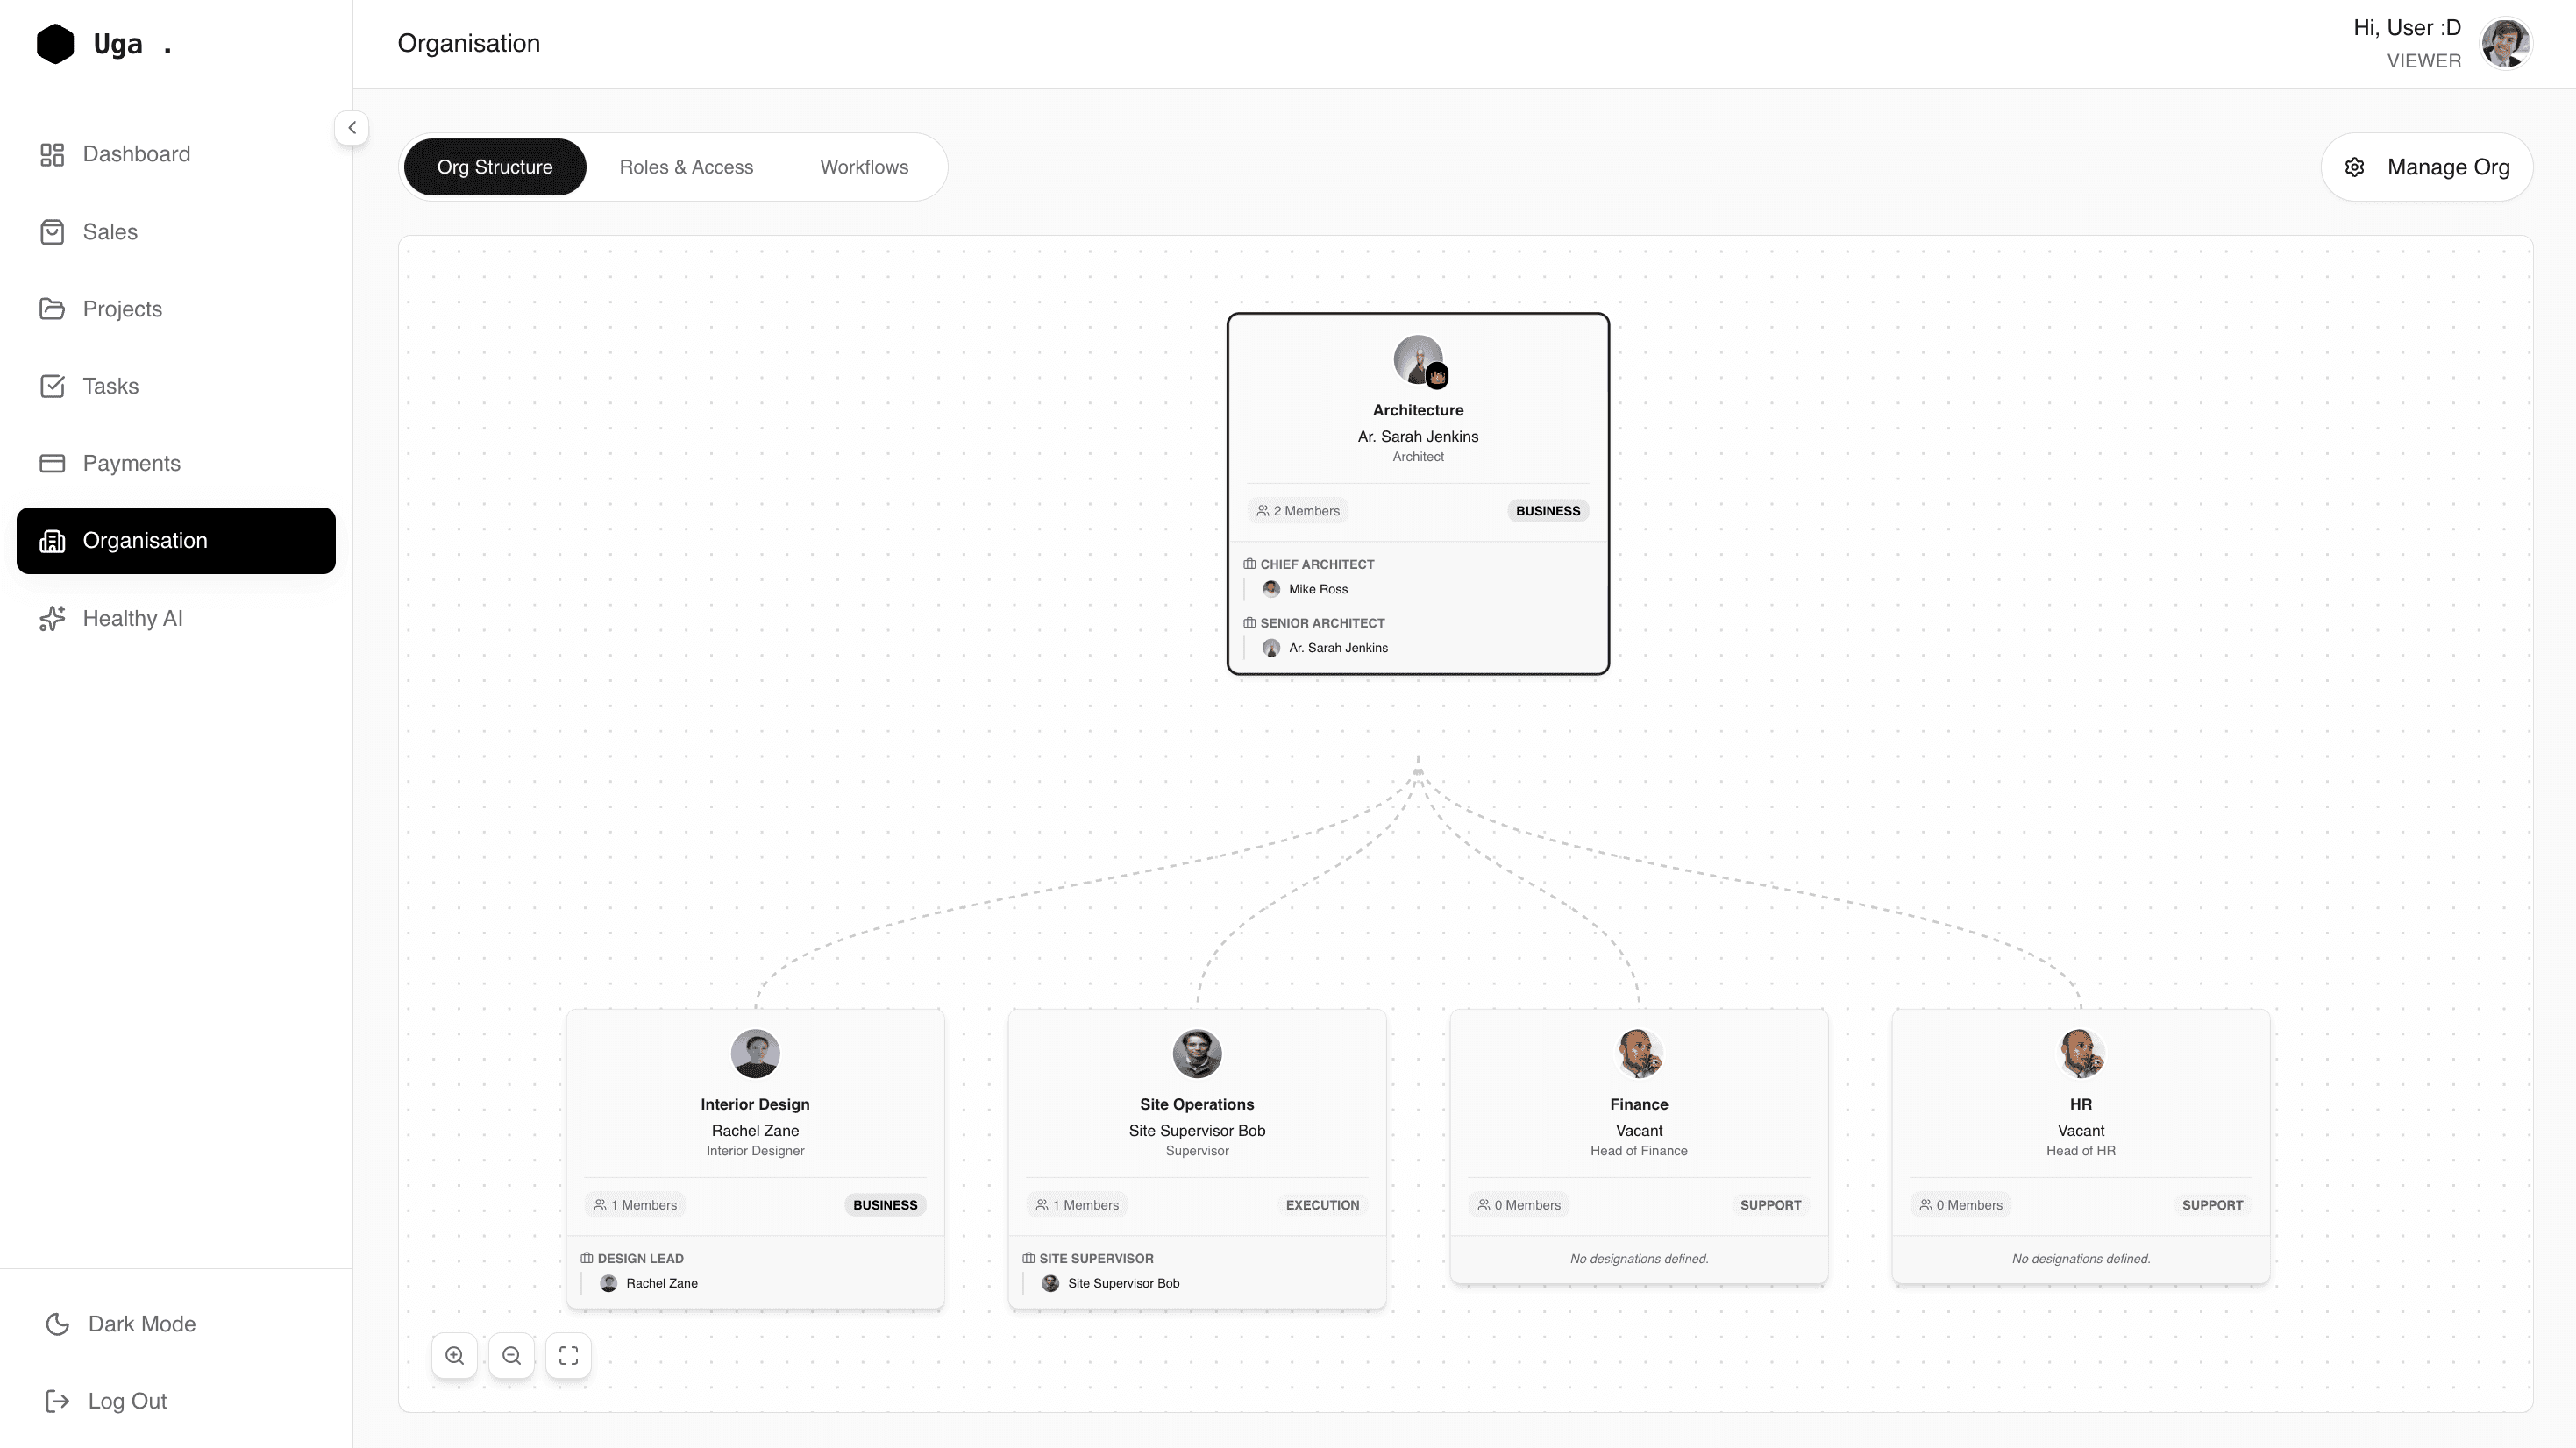
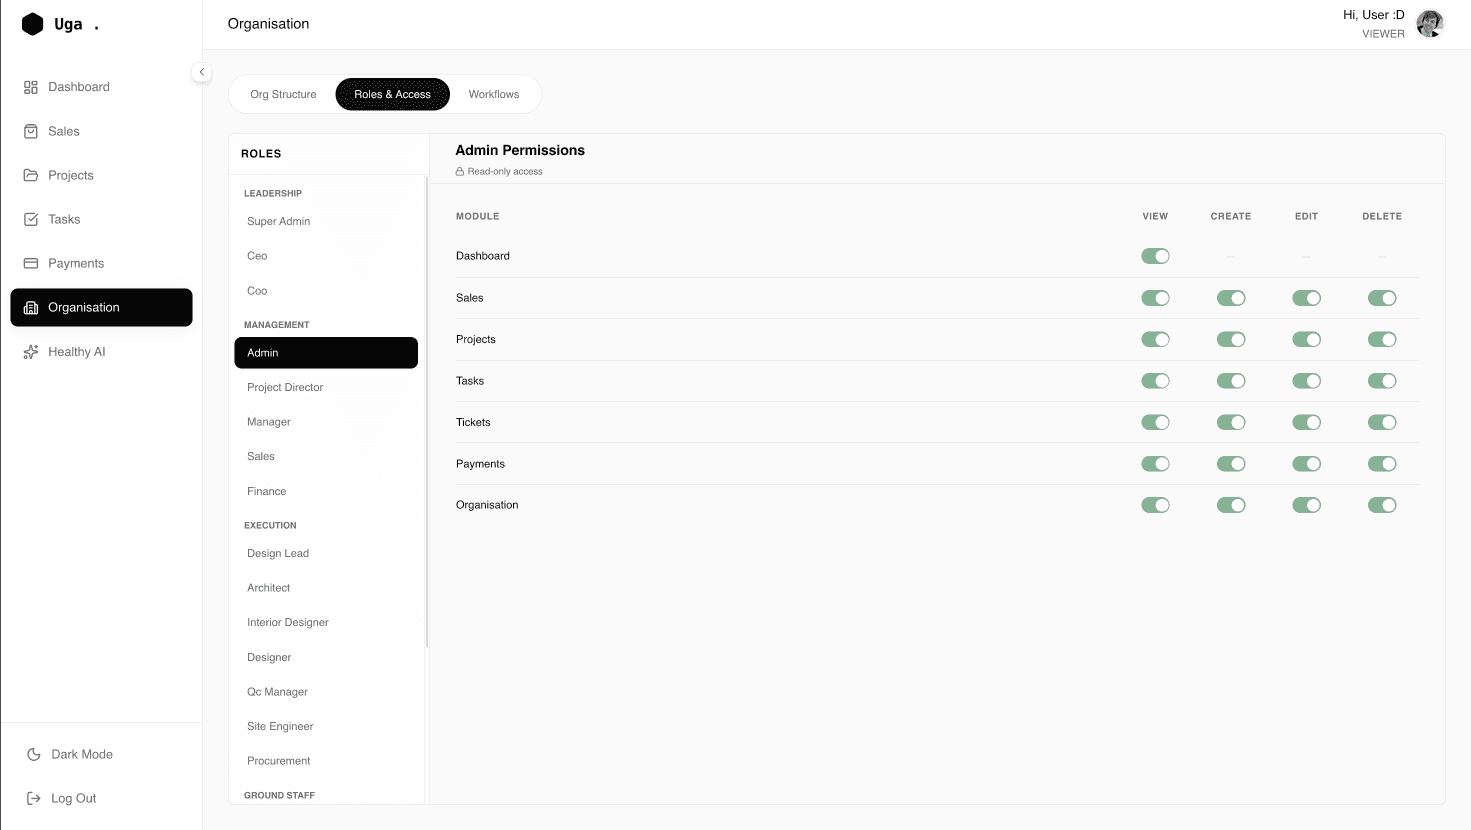
Q1. Why does structure matter in this product?
Because access and responsibility must scale with growth.
Q2. What does this page control?
Roles, permissions, and team structure.
Q3. What failure does it prevent?
Unauthorized access and operational chaos.
Q1. Why does structure matter in this product?
Because access and responsibility must scale with growth.
Q2. What does this page control?
Roles, permissions, and team structure.
Q3. What failure does it prevent?
Unauthorized access and operational chaos.
What you’ve seen is not a concept — it’s a working system designed to be measured, questioned, and improved.
Let's Work Together
pharisshajeer@gmail.com
+91 96 11 307 197
India · Open to remote > hybrid > on-site
Tablet Responsive Work In Progress 😎
Desktop recommended for the best experience.
This portfolio is optimized for large screens to clearly present complex systems and flows.
Desktop recommended for the best experience.
This portfolio is optimized for large screens to clearly present complex systems and flows.